By guest author Thorben Janssen
The StackTrace is one of the key concepts in Java. It’s a call stack for the thread and lists all method calls since the start of the thread. You have probably seen its textual representation in your log file or console output. It gets printed to System.out whenever an exception is thrown and not handled by your application. The following snippet shows a typical example of such an output.
java.lang.NumberFormatException: For input string: "123a45"
	at java.base/java.lang.NumberFormatException.forInputString(NumberFormatException.java:68)
	at java.base/java.lang.Long.parseLong(Long.java:699)
	at java.base/java.lang.Long.valueOf(Long.java:1151)
	at org.thoughts.on.java.TestStackTrace.testStackTrace(TestStackTrace.java:17)
	at java.base/jdk.internal.reflect.NativeMethodAccessorImpl.invoke0(Native Method)
	at java.base/jdk.internal.reflect.NativeMethodAccessorImpl.invoke(NativeMethodAccessorImpl.java:62)
	at java.base/jdk.internal.reflect.DelegatingMethodAccessorImpl.invoke(DelegatingMethodAccessorImpl.java:43)
	at java.base/java.lang.reflect.Method.invoke(Method.java:567)
	...
Using monitoring tools, like FusionReactor, or by calling the getStackTrace() method on the current thread, you can access the StackTrace for all active threads in your JVM. But there are other ways to examine and work with a StackTrace.
In most cases, you will not look at a StackTrace until you need to analyze an Exception. The StackTrace is part of an Exception object, and it shows all method calls that happened until the exception was thrown. That shows you where the exception occurred and how you reached that specific part of the code.
In the next step, you can then analyze your code and find out what caused the exception. But that’s a topic for a different article. In this one, I want to tell you more about exceptions with their StackTraces and all the information they provide, so that you have a better understanding of StackTraces in Java.
Exceptions in Java
An exception gets thrown whenever an error happens within a Java application. It gets represented by an object of the java.lang.Exception class or one of its subclasses. The JDK provides you with a huge set of different Exception classes. If you want, you can also implement your own business exceptions.
It’s a general best practice to use the most specific exception class for each error. A typical example for that is the valueOf method of the java.lang.Long class. You can call it with a java.lang.String and it throws a java.lang.NumberFormatException if the String has a format that can’t be parsed to a Long. The NumberFormatException is a subclass of the IllegalArgumentException, which indicates that an invalid argument value was passed to a method. As you can see, the IllegalArgumentException would describe the error situation, but the NumberFormatException is more specific and should be preferred.
private Long parseToLong(String s) {
	return Long.valueOf(s);
}

Long l;
try {
	l = parseToLong(s);
} catch (NullPointerException npe) {
	// handle NullPointerException
	log.error("No value provided. Using 0 as default.", npe);
	l = 0L;
}
log.info(l);
Using the most specific exception class makes your code easier to read, and it enables you to implement a different catch clause for each exception class. This allows you to handle each error situation differently.
You could, for example, decide to throw a NullPointerException if the provided String is null and throw a NumberFormatException if it doesn’t have the correct format.
private Long parseToLong(String s) {
	if (s == null) {
		throw new NullPointerException("String can't be null");
	}
	return Long.valueOf(s);
}
In the code that calls this method, you can then implement 2 separate catch blocks that handle the NullPointerException and the NumberFormatExceptions in different ways. I did that in the following code snippet to provide different error messages for both situations. But you could, of course, use the same approach to implement a more complex error handling or to provide a fallback to default values.
Long l;
try {
	l = parseToLong(s);
} catch (NullPointerException npe) {
	// handle NullPointerException
	log.error("No value provided. Using 0 as default.", npe);
	l = 0L;
} catch (NumberFormatException nfe)	{
	// handle NullPointerException
	log.error("Provided value was invalid. Using 0 as default.", nfe);
	l = 0L;
}
log.info(l);
The structure of a StackTrace
In the previous code snippet, I wrote log messages that contained the caught exception objects. The following snippet shows an example of such a message in the log file. Your application writes a similar message for all unhandled exceptions to your console.
15:28:34,694  ERROR TestStackTrace:26 - Provided value was invalid. Using 0 as default.
java.lang.NumberFormatException: For input string: "123a45"
	at java.base/java.lang.NumberFormatException.forInputString(NumberFormatException.java:68)
	at java.base/java.lang.Long.parseLong(Long.java:699)
	at java.base/java.lang.Long.valueOf(Long.java:1151)
	at org.thoughts.on.java.TestStackTrace.parseToLong(TestStackTrace.java:39)
TestStackTrace.java:39
	at org.thoughts.on.java.TestStackTrace.testStackTrace(TestStackTrace.java:18)
TestStackTrace.java:18
	at java.base/jdk.internal.reflect.NativeMethodAccessorImpl.invoke0(Native Method)
	at java.base/jdk.internal.reflect.NativeMethodAccessorImpl.invoke(NativeMethodAccessorImpl.java:62)
	at java.base/jdk.internal.reflect.DelegatingMethodAccessorImpl.invoke(DelegatingMethodAccessorImpl.java:43)
	at java.base/java.lang.reflect.Method.invoke(Method.java:567)
As you can see, the log message contains a long list of class and method names. This is the textual representation of the StackTrace of the exception. Whenever a new method gets called, it gets added to the top of the stack, and after it got executed, it gets removed from the stack. Based on this approach, the last method that got called before the exception occurred is at the top of the StackTrace and logged first. The following elements in the StackTrace and lines in the log file show which methods were previously called to reach the part of the code that caused the exception.
Using StackTraces to analyze incidents
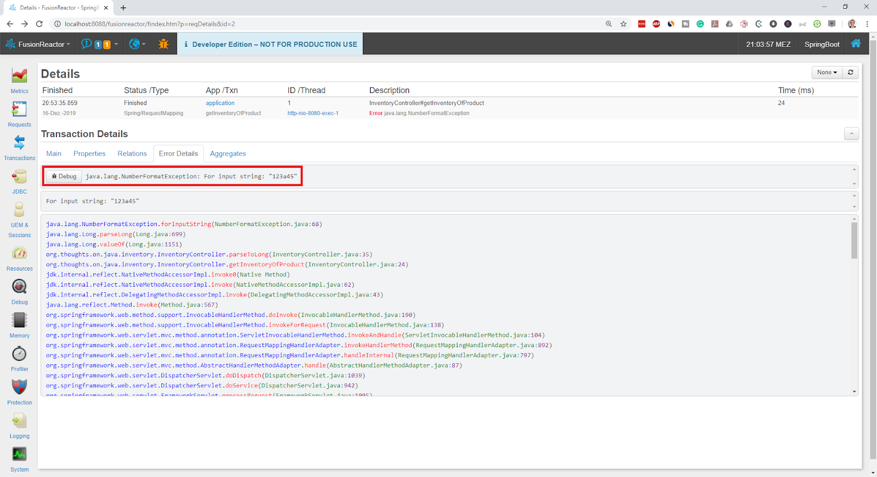
If you take another look at the previously shown StackTrace, you can see that the exception was created in the forInputString method of the NumberFormatException class. The actual problem occurred in the parseLong method of the Long class, which was called by the valueOf method of the same class, which was called by parseToLong method of my TestStackTrace class. As you can see, the StackTrace provided by the NumberFormatException clearly shows where the exception happened and which chain of method calls lead to it.
This information is a good start to analyze an exception and to find the actual cause of it. But quite often, you will need more information to understand the issue. The Exception object and its StackTrace only describe which kind of error occurred and where it happened. But they don’t provide you with any additional information, like the values of certain variables. This can make it very hard to reproduce the error in a test case.
How FusionReactor can help
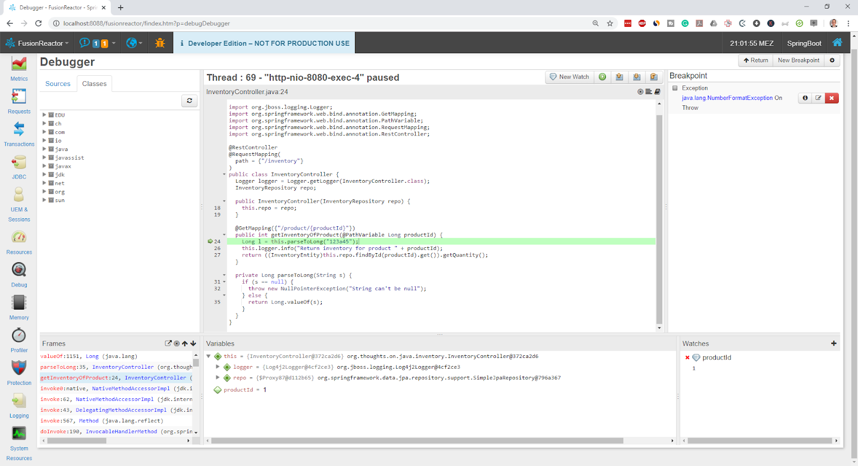
FusionReactor can provide you more information about the error situation. If you want, you can even debug the issues on your live system when it occurs next time.
The only thing you need to do is to log into the web interface of the FusionReactor instance that monitors your application, select the exception from the “Error History” and go to the “Error Details” tab. There you can activate the debugger for this specific exception.
After you’ve done that, FusionReactor will send you an email when the exception occurs again and pause the thread for a configured amount of time. The email contains the stack trace and information about the variable context. As long as the thread is paused, you can also use FusionReactor’s Production Debugger to debug the error in a similar way as you would in your IDE without affecting any of the other threads of your application.