Remote debugging is not a new concept and you can find numerous articles explaining how to setup various IDE’s such as Eclipse, Netbeans or IntelliJ to perform remote debugging of a Java Application.
If you’ve searched and found this article, you will have your reasons for why you want to be able to do this e.g. local debugging is not possible, the code you wish to debug is not running on your local machine or the problem you’re trying to isolate only occurs on another environment (usually production) etc. OK, now it’s getting scary, did you ever think of debugging a remote java application which is running in production? Maybe you’ve heard developers say, “We can’t reproduce the problem, it only ever occurs in production – If ONLY we could debug it”.
Before we go any further though, let’s take a step back and look at the main reasons you may NOT want to debug a remote (production) application. (Make sure to read on, to understand how FusionReactor addresses and solves these concerns though!)
- When you set a breakpoint – it could halt your whole application as the breakpoint would (theoretically) trigger on all threads at that point in the code. Ouch – well you definitely don’t want that happening in production.
- When you use a debugger – you imagine sitting in-front of it and stepping through your code – i.e. you set a breakpoint – allow your application to run to that point in the code and then take a look at some variables. However, what happens if you’re not in control of when the breakpoint fires? What happens if your breakpoint would only fire in a rare corner case, which is what you’re actually trying to figure out. Well, then you could be faced with a long wait before that breakpoint would ever fire – order the pizza, it could take a while….
- Attaching ECLIPSE or some other IDE is going to cause too much system overhead and it’s also fairly tricky to setup. Or, you’re using an IDE which doesn’t even allow remote debugging.
- The core developer perception that you should not use a debugger in a production environment (very probably based on the reasons mentioned above).
Well, if you’ve got this far, then hopefully I’ve got you sufficiently enthralled to find out how FusionReactor can solve all of these production debugging related issues. Read on – all will be revealed…
- Problem: Breakpoints affect all threads. Solution: FusionReactor has implemented a suite of (patent pending) control mechanisms by which the debugger interacts with the environment it’s running on. Examples of these control mechanisms are:
- Fire once (or n times) for any breakpoint which means only 1 thread would ever be affected even when the break point fires.
- Controlling the debugging capability from a specific IP address.
- Rate limiting the number of threads which can be paused in the debugger at any 1 time or how many threads a single break point can pause. If an application server has a thread pool of 16 you could say only 2 threads can be paused at once (either globally or per breakpoint)
- Thread pause timeout : if you (the user) would not intercept a paused thread within a specific time then FusionReactor will release the lock and allow thread execution to continue. This reduces the thread pause time to n seconds when debugging on a production server. When used with the thread limits or file count limits this reduces the possible impact to 1 thread only 1 and only for n seconds.
- Problem: If you’re debugging, you usually have to wait for a breakpoint to fire – which could be a big problem if you’re waiting for that elusive issue to occur. Solution: FusionReactor is capable of holding a single thread either for a period of time in hours, minutes, seconds – or indefinitely. This removes the need for the developer to babysit the application waiting for the trigger to fire. Essentially, it enables the debugger to run in an ‘Unattended’ fashion – rather than it would typically i.e. one would usually, always attend a debugger whilst using it.
- Problem: Setting up remote debugging is tricky and incurs too much overhead. Solution: FusionReactor is simple to install and has its own built in IDE for debugging – FR is designed to be installed on production servers and has an overall impact of <1%. For the debugging part, it uses the JVMTI library from the Java Virtual Machine. This exposes a debug API to our debugger (this is the same method used by other IDE’s like Netbeans and Eclipse). Getting this configured in FusionReactor is simple. The normal impact of having FR’s Debugger installed is ZERO (unless you use java 1.6.0.21 or earlier due to a bug in Java) apart from the memory used to load the library into memory. FusionReactor only enables the features in JVMTI when the user wants to use them. So only when a break point is set will it start to process class load events to install break points into those classes. Exception event hooks only become enabled when the exception breakpoint trigger is configured and enabled. It’s a small price to pay for the benefits you get.
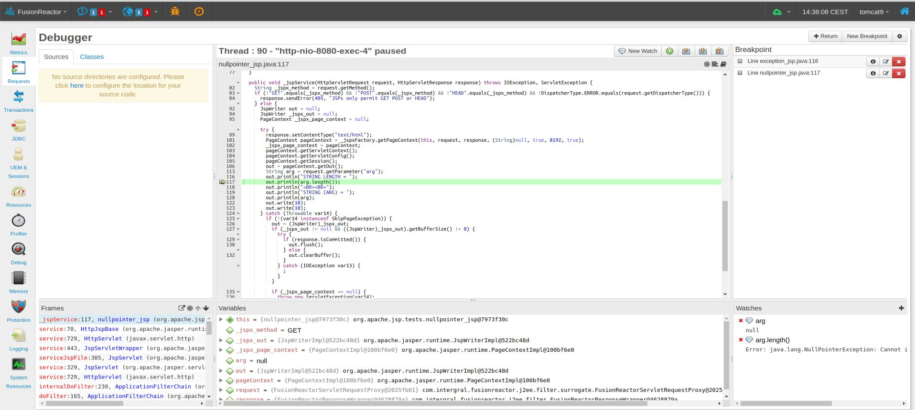
Here is an image of what the integrated debugger looks like (within FusionReactor).
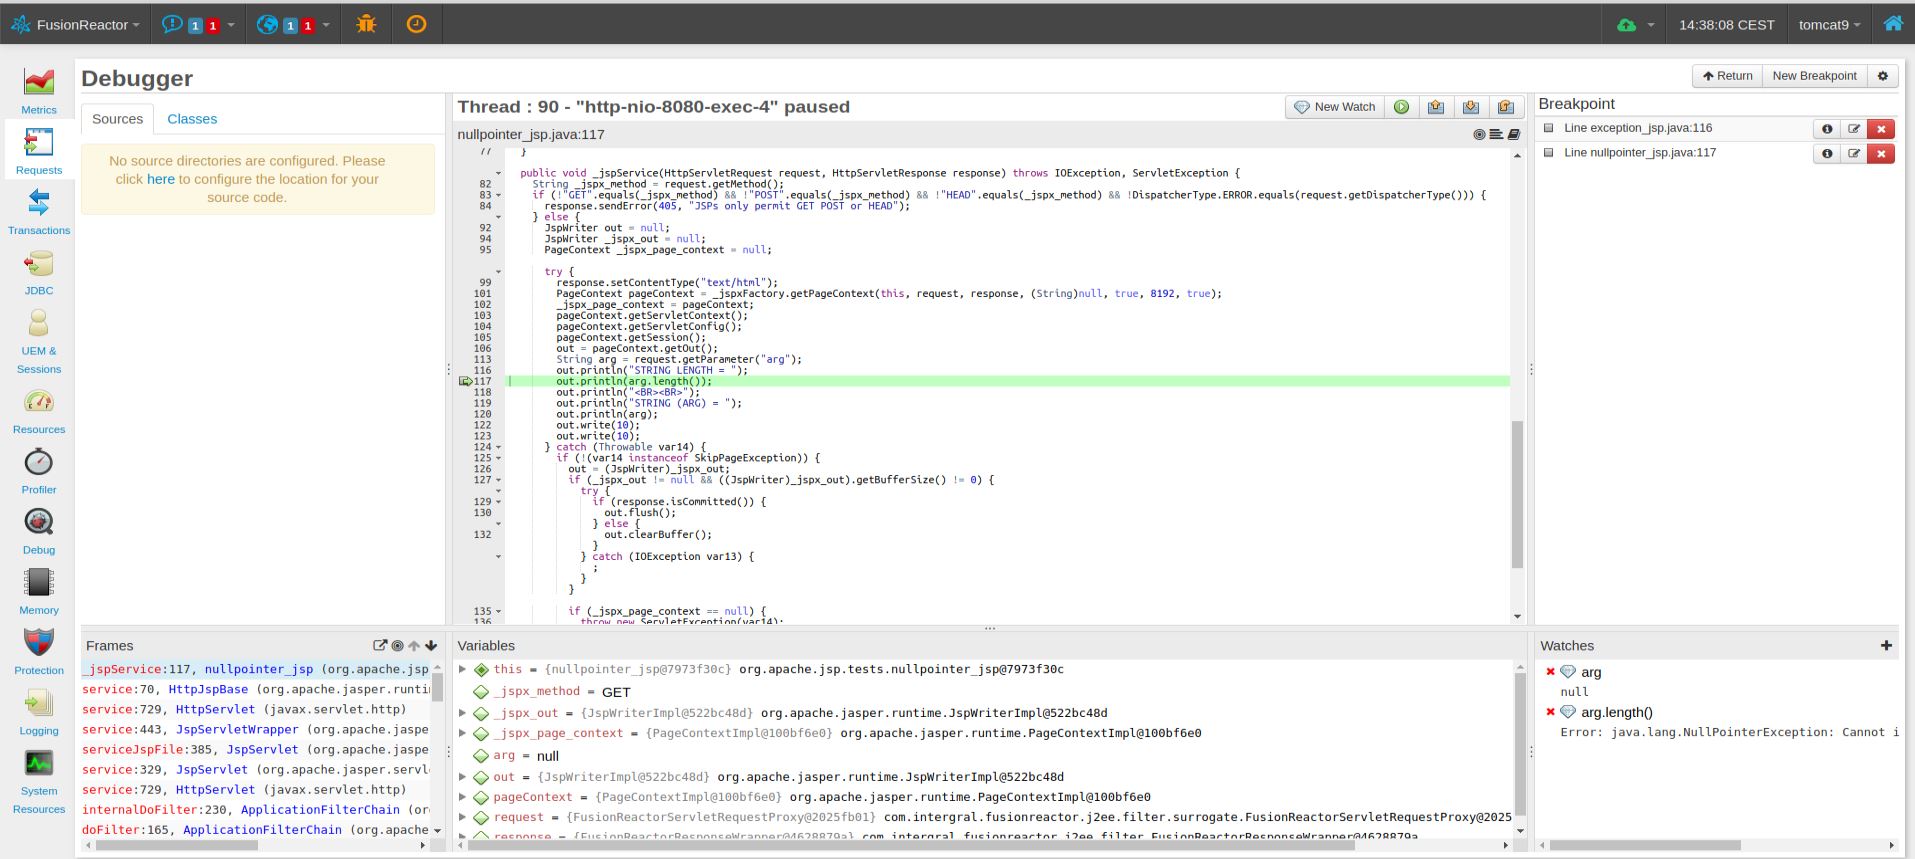
As you can see, it’s very similar to most other IDE style integrated debuggers and this is completely built into FusionReactor. The debugger includes the following features.
- Source code and line number specific breakpoints.
- Java Method Entry breakpoints.
- ColdFusion Function Entry breakpoints.
- Field access and modification breakpoints.
- Exception being thrown and exception caught breakpoints.
- Email alerts.
- Breakpoint samplers.
- Conditional breakpoints.
- Rate limiting.
- Interactive debugger.
- View source code when configured in the Sources page
- View decompiled code for classes without source.
- Change variables at runtime.
- Step into, out and over source code.
Installing the debugger and activating FusionReactor
Go get the latest version of FusionReactor from our download page – https://fusion-reactor.com/download/
Installation is very easy – you can install FusionReactor either using the automated installer or you can install it manually. If you use the automated installer, then the debugger library will be automatically installed for you. If you perform a manual installation – then you need to follow these steps.
Once installed you will need a trial license – which gives you 14 day access to all FusionReactor features (including the debugger) – you will be provided with a trial license from the download page.
Here are links to some resources to get you going…
- Learn more about the FusionReactor Java monitor
- Installation Videos for FusionReactor
- Video Tutorials on using the debugger – from our YouTube Channel
- Debugger documentation
- Debugger examples
Well I hope that’s whet your appetite and you’re ready to start remotely debugging those production Java servers.


