

Why debugging in production is so tempting?
In one of my first jobs, one of the tasks I had was to fix a bug which used to occur from time to time in a very complex production system. That is easy! – I thought. I will reproduce the same situation in my development environment, find the broken line, implement a quick fix and it’s done! However, it turned out that reproducing exactly the same scenario which occurred in production, was not possible – so after some time, I gave up this idea. I was forced to spend days analyzing logs and trying to correlate many different events, to come up with an idea of what might have happened. Soon, I realized that it’s as tedious as looking for a needle in a haystack. A couple of fruitless days later, I came to the conclusion that I would need to add more logging here and there and wait a couple of days or even months to see if the bug occurred again. Then I thought that hunting bugs in production is somehow crude, compared to the sophisticated tools we have when developing an application. You’re implementing a new feature and seeing that the result of what your service returned is not what you had expected? You just put a few breakpoints in and click the Debug button! A few moments later, you know exactly what happened. Wouldn’t it be awesome to do the same in a production environment?
Why debugging in production is so hard?
Wait a second! – you might have thought. But don’t we have the remote debugging features in most of the modern IDEs? Couldn’t we just connect to the running production application and debug it as we do from our local environment? While it’s possible, another problem arises: most of our business applications handle many requests per second. There is no easy way to control breakpoints firing everywhere when your application is being remotely debugged. As you can imagine, we don’t want to block all of our users from using our application when we decide to debug it. More often than not, we also can’t just force our application to reproduce the bug which happened yesterday – sometimes the only way to do it is to wait until it occurs again to one of our users. Thus, keeping a remote debug session in production, without a strict control of how breakpoints fire, is like putting landmines in the forest and inviting our users to run through it.
A better and above all – safer way
FusionReactor is an Application Performance Monitor, which comes with many advanced capabilities which you wouldn’t normally expect to find in monitoring solution. One of these, is the production debugger, designed to allow you to get low-level debug information from your production runtime environment – without affecting performance and without the issues and obstacles you would have with a traditional debugger.
One of the main issues, you would be faced with, using a traditional debugger – is that, once a breakpoint is set, it would fire for any thread which crosses that point in the code. FusionReactor overcomes this, by having a range of techniques to control the way a breakpoint should fire. For example, it can limit the number of times (threads) that a given breakpoint will trigger – which solves the problem of impacting too many users. Need more ways to control it ? We can even configure a breakpoint to fire for a user from a specific IP address (session), or when a specific variable matches a value or when a specific exception takes place ! However, what if a breakpoint triggers at night when nobody from our team is watching? The folks at FusionReactor have thought of this and the product allows you to define thread pause timeouts so if you would not intercept a paused thread within a specific time then the debugger will release the lock and allow thread execution to continue. When used with the thread limits this reduces the possible impact to one thread only – and only for n seconds, minutes or hours…
Another great benefit, is that FusionReactor can send out an email with the stack-trace and variables at the point that the trigger fires. This gives you a very flexible and unobtrusive way to get notified with plenty of information to make debugging easier than ever before. It’s a LOT better and simpler than adding debug/log file code into your production applications! For one thing – you don’t have to remember to remove the debug code in your production application !
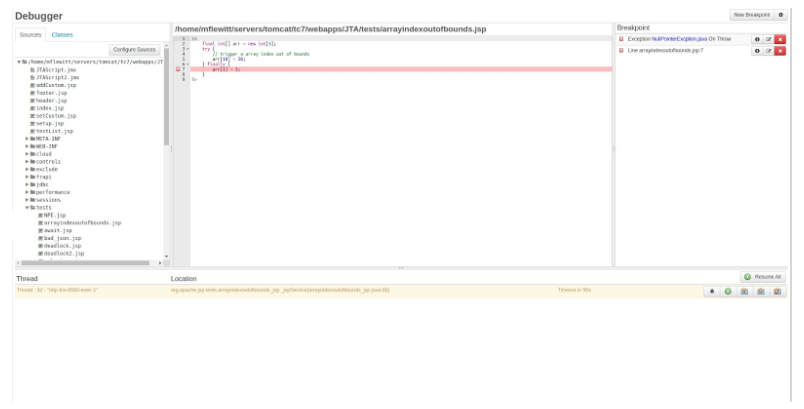
If that’s not enough to convince you that debugging in production doesn’t have to be cumbersome, FusionReactor is shipped with a fully integrated IDE-style debugger which runs directly in your browser – no need to install additional fat clients to start remote debugging. Everything is built in and ready to go.
Summary
What I described here is not a vision of the future it’s available now and it’s safe, secure and simple to use. The alternative is (of course) good old log files, which we all know have their limitations. I don’t see any reason to spend countless hours digging through log files hoping to find the needle in the haystack – using logs are “archaic techniques” and I think maybe it’s time to finally start using tools for the 21st century 😉