

Java stack traces are a valuable tool for debugging problems in your Java application. They provide a report of the sequence of method calls that led to an error, starting with the method that caused the error and going back to the initial method call. This article will discuss how to understand and interpret Java stack traces to help you troubleshoot and fix problems in your application.
What is a Java Stack Trace?
The stack is an important part of the Java runtime environment, it is used to store local variables and method calls for each thread in an application. If you understand how the stack works and how to interpret a stack trace, you can often pinpoint problems in your Java application.
A stack trace is made up of a list of stack frames. The collection of these frames (which make up the stack trace) represents a moment in time during an application’s execution. A stack frame contains information about a method or function that your application called.
A Java stack trace is a snapshot of the current state of the stack for a thread in a Java application. It can be used to identify the source of an error or other issue in the application. Whenever an error is thrown, the stack will comprise of a collection of function calls that lead up to the call that caused the error. This is based on the LIFO (Last In, First Out) behavior of the stack.
Using a debugger can be helpful in understanding the stack (which is built into FusionReactor). It can also help to write log messages to track the state of the stack at different points in the application. FusionReactor will automatically capture the complete stack trace, together with references to the underlying code and variable scope context for each variable on the stack.
What sort of errors can be identified via a stack trace?
This can help you identify issues such as:
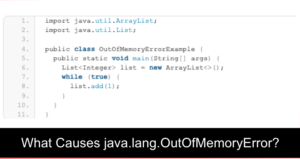
- Stack overflows: A stack overflow occurs when the stack runs out of space and is unable to store new variables or method calls. This can be caused by an infinite recursion or a large number of nested method calls.
- Incorrectly allocated variables: If variables are allocated incorrectly on the stack, it can cause problems such as null pointers or incorrect values.
- Incorrectly implemented method calls: If method calls are implemented incorrectly, it can cause issues such as incorrect return values or unexpected behavior.
By understanding the stack and how it works, you can often pinpoint problems in your Java application and take steps to resolve them.
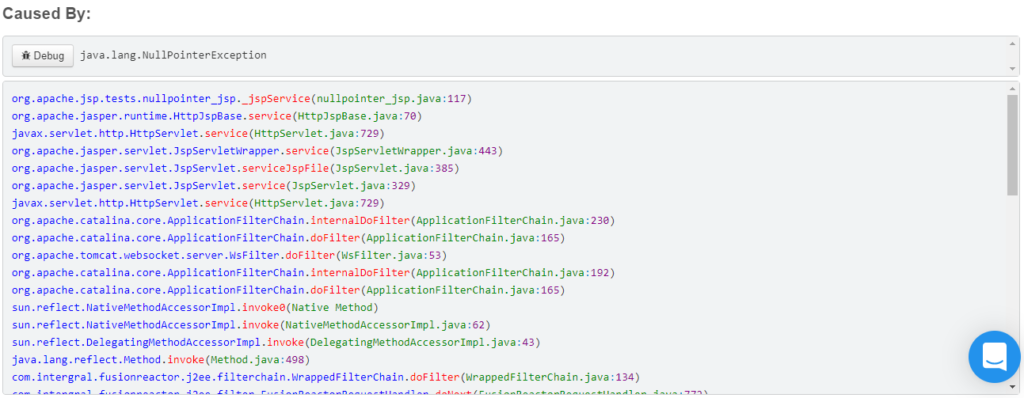
A typical stack trace
The screenshot below shows what a stack trace looks like as it’s rendered in FusionReactor. Classes and methods are clickable and will cause a class or method to be automatically decompiled if you have given permission to do so.
How to interpret and understand a stack trace
Debugging problems in a Java application often involves analyzing the stack trace of an exception or error. A stack trace is a list of method calls that shows the sequence of methods that were executed. The calls lead up to the point where the exception or error occurred.
To interpret and understand a stack trace just follow these steps:
- Identify the exception or error that occurred: The stack trace will typically start with a line indicating the type of exception or error that was thrown, along with a brief description of the problem. For example, an “out of memory” error message, it could indicate a problem with memory allocation.
- Look at the top of the stack trace: The top of the stack trace (the last method call in the list) is usually the point where the exception or error occurred. Use the top of the stack as the starting point for your analysis.
- Analyze scope variables: Access to scope variables is an essential part of understanding what is happening and why a specific issue is happening. FusionReactor provides scope variables using Event Snapshot.
- Follow the stack trace backwards: The stack trace shows the sequence of method calls that led up to the point where the exception or error occurred. If you follow the stack trace backwards, you can see which methods were called and in what order. This will help you understand the flow of control in your application and identify where the problem may have occurred.
- Check the parameter values and local variables: If you have access to the source code for the methods in the stack trace, you can check the parameter values and local variables to see if they contain unexpected values that might have caused the exception or error.
- Look for patterns: Sometimes, the same exception or error can occur in multiple places in your application. If you see the same exception repeating it may be useful to look for patterns or common causes that might be responsible e.g. you may see the same method being called repeatedly, which could indicate an infinite recursion.
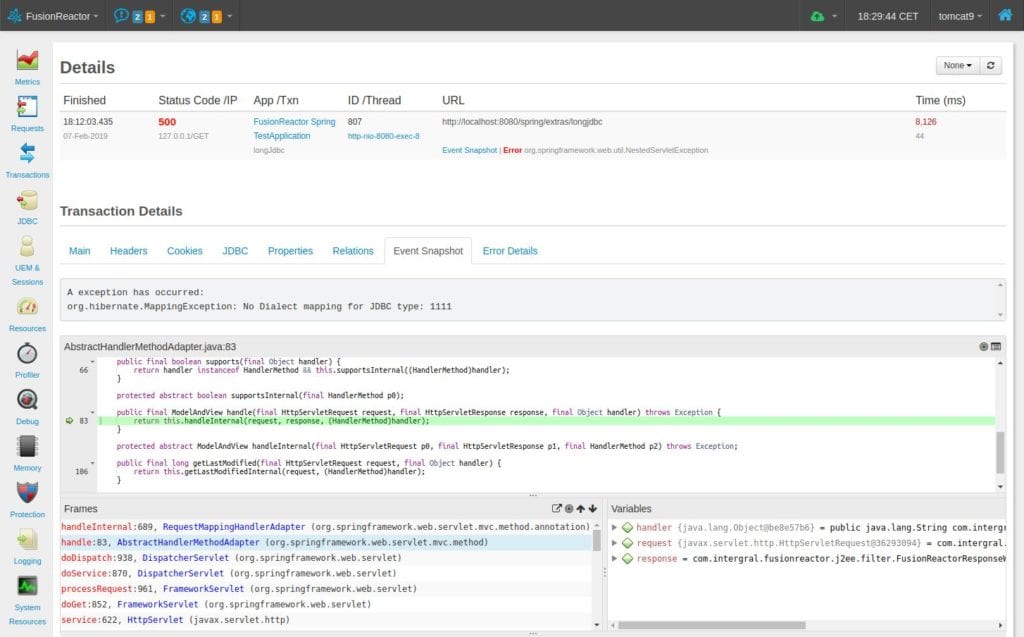
Using FusionReactor to automatically display the stack and scope variables
Whenever an exception occurs, FusionReactor will automatically capture these events in what we call Event Snapshots. These are intended to provide deep level insight whenever a problem, such as an exception or thread latency occurs. Snapshots are triggered automatically and will allow you to see source code, scope variables, stack trace and logging information at the point in the code that the problem occurs; providing everything you need to isolate the issue as quickly and efficiently as possible. The image below, provides an example of an Event Snapshot stack trace, code rendering and variable scope information.
Conclusion – How to Understand and Interpret Java Stack Traces to Debug Problems
In conclusion, Java stack traces are a valuable tool for debugging problems in your Java application. By understanding and interpreting the stack trace, you can quickly locate the source of the error and fix the problem. It’s essential to start by looking at the top of the stack trace, where the exception occurred, and then check the method calls that led to the exception and the initial call. Remember that stack trace can be truncated, so it’s important to use the -XX:-OmitStackTraceInFastThrow flag to get the complete stack trace. Following these steps, you can quickly troubleshoot and fix problems in your Java application, resulting in a more stable and efficient one.