

Someone asked me recently if FusionReactor could be used to do performance testing, specifically to test the performance of an application before and after upgrading their application server. I said FR COULD be used to help with that, absolutely.
In the same way, one could imagine testing various other significant changes, such as a large-scale change to your codebase, or to test an upgrade of the server or platform on which your app server is deployed, or an upgrade of your database/database server, or even to test a new version of FR itself. (I use the generic term “app server” because in fact–as may be a surprise to some readers–FR can be used to monitor either CFML engines like ColdFusion or Lucee, or indeed any Java application server or application like Tomcat, Jetty, Wildfly, Undertow, and so on. It can also be implemented in the execution of even a single Java class. For the sake of simplicity, I will use the term “app server” to cover any of them all.)
The folks then asked if I could write up some of the ways that FusionReactor (FR) could be used for such a testing effort, which led to this post. There are indeed several such ways: various features which FR offers, and they do mirror the many ways I’ve helped people see how FR could be used to monitor or troubleshoot their servers for years, but in this post, we will focus specifically on this aspect of how one might best leverage FR for such migration testing.
Long-duration vs short-duration testing
First, in terms of duration, some folks might be interested in implementing changes and testing them for days. This is especially true if someone may feel they’ve done adequate localized (perhaps manual) small-scale testing and now want to run more large-scale testing simply by just putting the change into production. That may make some gasp in horror, but not everyone has the ability or resources (or simply the experience or lessons learned) to lead them to do such “large-scale” testing in a testing environment (such as via load testing)
The good news is that there are features in FR that are especially well-suited to assess the aggregate performance of things over periods of full days, such that you could easily compare things from one day to another.
But still, other folks will do more short-term testing, such as in tests lasting hours (or even minutes). They may have tools or manual processes that they leverage which facilitate even “large-scale” testing without having to just “run it in production for a while”.
And there are still other aspects of FR that can help with doing such tests over smaller periods of time, such as one hour, or from the restart of their application server to another, and so on.
And while some aspects of such long- or short-duration testing, testing/assessment might involve features accessed in the FR user interface, still others would be about leveraging FR’s available alerts, reports, and logs. There’s a place for each, and I will cover both in this post.
Assessment after the test vs during the test
There’s another way to distinguish the ways one may use FR for such an assessment of testing. In either of the above cases (long- vs short-duration testing), the FR features to help with those would primarily be focused on assessing things AFTER running the test(s). But there are still other aspects of FR which could be useful during such testing to help understand WHY something’s amiss during the test especially if one of the tests proves to have especially troublesome performance.
Someone might assert that this is not really about “assessing the performance of the test”, but unless you have a way to readily diagnose the real cause of such a problem, you can’t know WHAT may be the CAUSE of such poor performance or of many errors–and it may or may not be down to the actual “new version” being tested, but rather could be something totally unexpected. I would be remiss not to at least mention these other facets of using FR, rather than to presume that “everyone” already knows about them. They are all tools in the belt of someone assessing the impact of major changes that might be implemented in your application or architecture.
The bottom line is that whatever your need for and approach to “performance testing”, you should get value from considering the various ways FR can help.
On whether your app server is restarted between tests
Before moving on to the FR features, there’s one more aspect of how one might go about doing such testing, and that’s whether one would restart their application server (CF, Lucee, Tomcat, Wildfly, Jetty, Undertow, or whatever) between your tests. Of course, if what you’re changing IS the versions of the app server, then this may seem a moot point. But even if one might be testing, for instance, the impact of a change to the database server (running on a remote machine or platform), it may not seem so obvious to someone that one would or should restart their app server.
Certainly, there can be advantages of doing a restart between tests: there may be information cached in the app server, such that if you don’t restart, the second test could be impacted-either positively or negatively–by such cached information remaining from the first test. It could make the second test seem faster (if it positively leveraged what was cached in the first test), or it could make the second test fail (if the information cached was incorrect for the second test).
It’s probably best in most cases to do such an app server restart between tests. (Some might go so far as to also restart the server–physical or virtual or the container–on which the app and app server are running. Again, an argument could be made for doing that, so that each test starts from the same “square one”.)
But I also mention all this in the context of the impact on FR of such an app server (or indeed server) restart. Since FR (as a Javaagent) is implemented WITHIN the app server, FR will restart along with the app server–and all the data tracked within the FR UI will be reset. Again, that is generally a good thing, but I wanted to clarify the point. But note as well that several FR features discussed here can still track information OVER restarts (meaning even if the app server is restarted), which may surprise some who’ve grown accustomed to JVM-based monitors that “lose everything” on an app server restart.
Beware changing more than one thing at a time, during such testing
Before moving on to the FR features for assessing testing, I want to make a plea to please be careful when doing such testing, to be wary of making too many changes at once.
I have very often helped people who were making migration to something (such as a new version of their app server), and when they do find those odd things perform poorly, but it turns out often that it’s not BECAUSE of that thing one they are focused on changing, but instead, it’s they have indeed changed still OTHER things: such as deploying the new app server version to a new machine, perhaps running a new OS version as well, or perhaps changed from being on-prem to running in the cloud, or changing from one infrastructure (for instance, hosting) provider to another, and so on. Indeed, often they have also changed the DB version they’re running, and perhaps changed where the DB exists, and perhaps are running that on a new OS or different infrastructure.
The point is that sometimes when there are problems in such a “migration”, it’s not at all down to that “one thing they were focused on”, but could be influenced by any or many such other changes.
With those prefatory remarks out of the way, let’s look at some in more detail, first with that focus of assessing things over time (in aggregate) AFTER the tests, then we’ll wrap up with a brief discussion of options for assessment/diagnosis DURING the tests, for those who might benefit from knowing of that.
FusionReactor features enabling assessment over time, after tests
There are at least 4 key FR features that could help in assessing the processing of one version of a thing against another version when those tests are run one after another:
- FR’s reports
- FR’s logs
- FR’s archived metrics feature
- FR’s CP email alerts
Let’s look at each of these a bit more closely.
FusionReactor’s reports
Especially when one may be doing long-term testing, where the test of one version would be running all of one day (or period of days) while another test would follow on subsequent days, one could leverage FR’s “reports” feature. These are produced daily, weekly, and monthly, depending on your FR version, and they offer a succinct, high-level assessment of processing within the instance of the app server being monitored, which can be easily used to compare the aggregate performance before and after an upgrade being tested.
(You would be forgiven if you may say that you never knew that FR even offered such reports. They are only enabled if you configure your FusionReactor instance to provide the email addresses and mail server through which to send the reports. While there is a “notification” alert that appears via an icon at the top left of FR if you have not bothered to configure the mail settings–which shows you how to implement that change, many folks never notice the reports until perhaps they setup the same mail settings for the sake of getting FR Crash Protection email alerts. Nothing more needs be done to start getting the alerts.)
I mentioned that the reports received depend on the version of FR you have. All FR versions have daily reports, while those running the Enterprise or Ultimate edition also get weekly and monthly reports. For the sake of this testing, let’s focus on the daily reports.
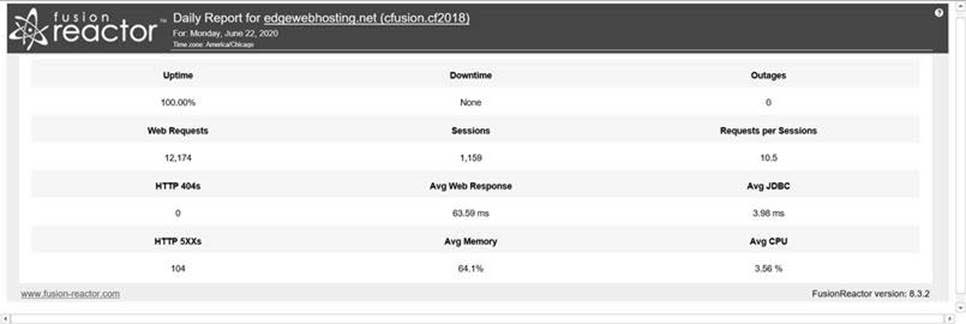
Here’s an example of a daily report looks like if you’re running FR Standard:
And here’s what one looks like if you’re running FR Enterprise or Ultimate:
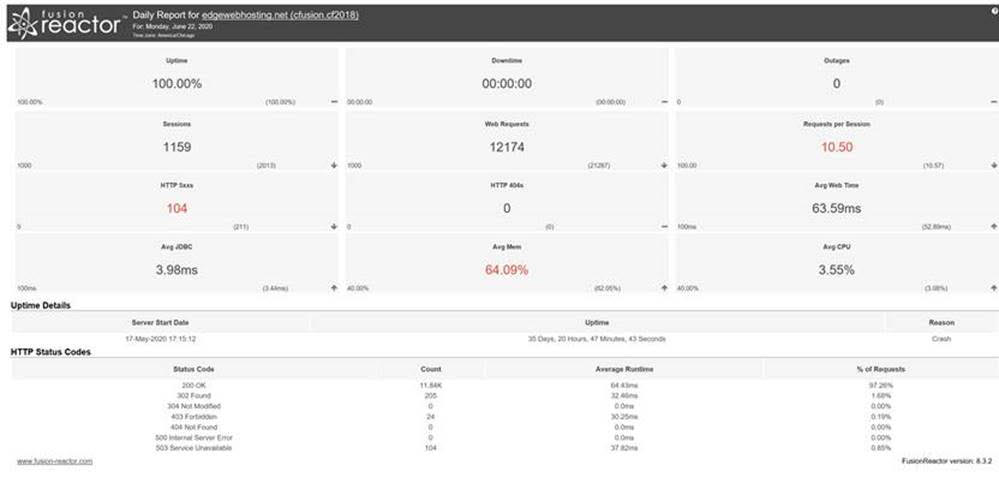
They both contain essentially the same info at the top of each report: for the sake of the kind of testing we’re discussing, note how it tracks things like how many requests ran and how long they took (“avg web time”), as well as the average query (“Avg JDBC”) time, and a count of requests getting status code 500 (error) or 404 (not found). It also tracks the avg CPU and “mem” (heap used), as well as things like counts of sessions, outages, and up and downtime for the instance.
Again, these are tracked for an entire day. So you can see how many of these would be useful as aggregate values you could easily compare, for a test of perhaps a new app server version. If you had the reports from the days before making the change, and then made the change, you could readily see at a high level whether things have gotten better or worse. (But I realize that for some testing, you either won’t run the test for an entire day or won’t test the change in production so that you’d not be able to compare to previous days of production data. More on other features to assess such tests, in the next section.)
Before leaving the subject of the FR reports, I want to note as well that the reports are also configurable, including the option to include in the report any of over 180 available metrics (such as garbage collections, metaspace usage, sessions creation, network or disk usage, and more), in case any of those may be an especially important metric for your testing.
To learn more about the FR reports, including configuring to receive them, configuring the optional metrics, and to see the weekly and monthly reports, please see any of the following resources:
-
- https://www.fusion-reactor.com/daily-report-email/
- https://intergral.atlassian.net/wiki/spaces/FR82/pages/245548067/FusionReactor+Report+Plugin
- https://www.fusion-reactor.com/news/all-about-fusionreactors-daily-reports/
- https://www.fusion-reactor.com/news/5-things-you-should-check-every-day-to-ensure-your-application-health/
FusionReactor’s logs
When it comes to wanting to do a more granular assessment of things than over an entire day (making the reports unsuitable), there are of course FR’s logs. Since its inception, FR has done a tremendous job of tracking most of the data it tracks (in its UI) in logs as well.
And they track nearly everything that FR does, including:
-
- all the information in the FR metrics>web metrics page (logged every 5 seconds, in the resource.log)
- all the tracking of memory spaces and garbage collections (logged every 5 seconds, in logs whose names indicate the memory space or GC type being tracked)
- various high-level CF metrics (tracked every 5 seconds, in the realtimestats.log)
- every request (when it starts and ends, including high-level metrics tracked such as URL, query-string, IP address, request duration, number of queries, their avg duration, user agent, and more, tracked in the request.log)
As you can see, this information can be very useful to understand what happened during a period of time, such as during a test. FR’s logs are simply plain text, space-separated value logs which can easily be assessed either by hand or using tools like Microsoft Log Parser, or spreadsheet tools like Excel or OpenOffice Calc, and I have created webinars and other resources showing using such tools to analyze the FR logs to obtain important information over a given period time. Of course, they can also be processed by more modern log tracking and analysis tools like Splunk, Loggly, Sumo Logic, etc.
You can find the FR logs either by directly accessing them on the file system (where FR is installed) or in the FR UI, in an available Logging button on the bottom of the left navbar. FR’s logs are created (by default) in a “logs” folder holding the current hour, then at the top of the hour (or upon restart of the instance being monitored) the existing logs are zipped up and stored in an “archives” folder. The logging interface allows you to easily find and download the current logs or the past (“archived”) FR log zip files for any hour and any day (the FR logs are kept for 30 days, by default, and they take only a few meg of disk space per month, for most users).
There is yet another way to view the information in the FR logs; by way of the FR that includes even graphing them or more easily viewing them. That feature deserves its own section, next up.
To learn more about FR’s logs, including a guide to each log and its columns, as well as tools for analyzing them, see the following:
-
- https://intergral.atlassian.net/wiki/spaces/FR82/pages/245554255/Log+Files+Available+in+FusionReactor
- https://github.com/carehart/FusionReactor-Log-Headers
- https://www.fusion-reactor.com/webinar/26656/ (“Making the Most of FusionReactor’s Logs”)
- https://www.fusion-reactor.com/webinar/more-on-fusionreactor-log-analysis-via-excel/
- https://www.carehart.org/resourcelists/Using_LogParser_with_FusionReactor.cfm (somewhat dated, but still helpful)
FusionReactor’s archived metrics capability
Before leaving the topic of the FR logs, and using them to assess performance between tests, it’s very important to take a moment to discuss the “Archived Metrics” feature, which was introduced in FR 7.2. Indeed, one might never look directly at the logs of zip files, as discussed above, once they know about this feature. And again it can be very helpful for assessing the overall performance of the metrics that FR tracks, over the course of tests (from one hour to another, or simply one app server restart to another).
The Archived Metrics feature is available either via the Metrics or Logging menus in FusionReactor.
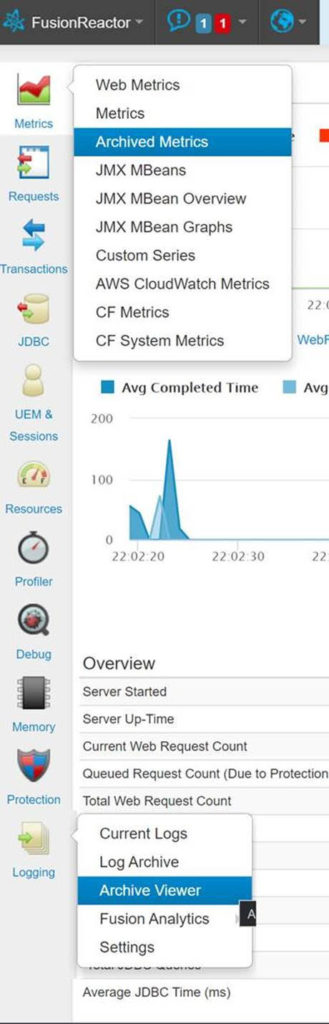
Most importantly, this feature will let you easily view all the FR logs, but in addition to simply being able to view them as text (including a helpful “spreadsheet” view that shows a column heading for each column in every log), the real power of the Archived Metrics is in its automatically graphing nearly any log you’re looking at. When viewing the resource.log, for instance, you are shown a set of graphs that look very much like the graphs on the FR Metrics>Web Metrics page. When viewing the memory or GC logs, you see graphs much like you would see in the pages under the FR Resources menu of the same name.
Better still, you can use the date and time picker features in the top left of the Archived Metrics page to look back in time, where you can see in effect what is in each FR log zip (so again, each hour or since each restart within an hour, for as far back as the logs are kept–30 days by default.)
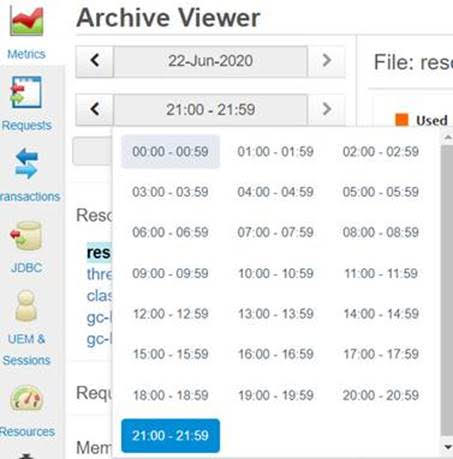
So you can see how easily you could use these aspects of the Archived Metrics to look back over your tests to understand how various FR-tracked metrics did change over time. Indeed, notice how the time picker (and date picker) in the previous image has a left and right arrow, allowing you to easily move from one timeframe to another, watching as whatever graphs you are viewing will have changed over that time, which makes it very easy to discern significant changes, such as when a test has been performed during one of those timeframes.
To learn more about the FR Archived Metrics feature, see the following:
Option to force rotation of FusionReactor logs, between tests
As an aside, regarding the FR logs and assessment during testing, note as well that the FR Logging>Log Archive page offers a button at the top, “rotate now”, that would allow you to force FR to create a new zip at that moment of whatever logs were currently tracked (since the top of the previous hour, or any previous instance restart, whichever happened most recently), which again could be helpful when you perform a given test, and then want to perhaps use the archive viewer (or your own log analysis) to assess what happened in that small timeframe.
FusionReactor Crash Protection (CP) email alerts
Finally, just like the FR reports and logs can be used to assess things after a test run, so too can the FR Crash Protection email alerts. They can serve both as indicators THAT there are unexpected problems, but can also provide details on the CAUSE of such problems. These alerts can be setup (in the Protection>CP Settings page of FR’s left nav bar), to be triggered to run when any of 4 possible trouble situations arise:
- too many requests running
- requests taking too long
- heap usage too high
- cpu usage (within the app server instance) is too high
And in addition to reporting THAT these things are happening, the whole point of these alerts is that they give far more detail about what IS happening (within the instance) at the time of the alert, including showing such things as:
- how many requests are running (at the time of the alert)
- every request running at the time of the alert (its URL, query-string, duration, IP address, user agent, the query being run, the total time of queries run so far, and more)
- a stack trace of every request and indeed (by default) every JVM thread, at the time of the alert
These details can be tremendous in understanding both what’s going on after a test (such as whether and how many such alerts may be created during a given test versus another), and of course, they can be used to understand and diagnose what’s going on DURING a test, which is broaching on the intended focus of the last section.
To learn more about FR CP email alerts, see the following:
FusionReactor features enabling assessment/diagnosis, during tests
As we move toward wrapping up this post, recall that at the opening I talked about a way one could regard FR features as those that could be used to enable “assessment over time, after tests”, while others could be used to enable “assessment/diagnosis during tests”. This section discusses the latter.
Of course, that distinction is somewhat arbitrary. For instance, there are times when the aforementioned logs could even be leveraged during a test (or troubleshooting session), while some things in this section could also be used to assess things after the test and over time, such as viewing the Requests>Slow Requests or Error History, and so on (as long as the app server had not been restarted).
Still, their primary value might be in helping diagnose things DURING a test. And there simply isn’t time or space here to detail these. As above, I will end this section pointing you to resources for learning more about these things.
But as you perform testing, you should definitely consider watching some of these key FR UI elements:
- Requests
- running requests
- slow/longest requests
- error history, event snapshot history
- response codes
- requests by memory used
- applications (see choices at the top of its screen)
- JDBC
- similar details as above, and also see the “databases” option (and see choices at the top of its screen)
- Transactions
- similar to requests and JDBC, but focused on any of several types of transactions that FR tracks, including cfhttp/httpclient calls, cfmail calls, etc.
- be sure to note the optional choices offered at the top of each screen, to control “type” of transactions shown
- See also the features for
- middlware sources
- external sources
- transit
- similar to requests and JDBC, but focused on any of several types of transactions that FR tracks, including cfhttp/httpclient calls, cfmail calls, etc.
- Request profiling (to understand where time is spent within a given slow request)
- Metrics>Web Metrics
- and its additional submenus, such as those related to JMX and CF
- UEM and Sessions
- UEM for focusing on time spent sending content back and forth to clients
- Sessions for focusing on counts of sessions in your application server
- Resources
- and its additional submenus, such as Memory, GC, etc
- Memory>View Heap
- to observe and track changes in heap use over time
- Event snapshots
- allowing additional details to be tracked (and sent by email) regarding application errors happening during testing
You can learn more about all these (as sections of the FR user interface) in the FR User Guide, starting here:
Conclusion
Phew, that was quite a whirlwind tour of the many possible ways that FR can be used to assist in assessing a migration to a new version of something, like a new version of your app server. Recall that we discussed both things to use after the test as well as during the test. We also threw in various bonus topics along the way, such as being careful not to change TOO many things at once, and also Fusionreactor Cloud as yet another tool to in the FR arsenal for assisting with such assessment during testing.
For more blog posts from Charlie Arehart, see his posts here as well as his posts at carehart.org. And follow him on Twitter and other social media as carehart.
Considering FusionReactor Cloud’s role in such an assessment
Finally, in addition to the traditional on-premise FR monitoring (enabled by the FR java agent, implemented in your app server), there is also the available FR Cloud feature, which is an add-on that causes nearly all FR monitoring data to be pushed up into the cloud, to a server/service provided by Intergral (makers of FR), made available securely (and only to those in an org given access to it). The FR Cloud UI offers still more powerful features for assessing performance and processing over time, and this data is kept for days or weeks depending on your FR version (Enterprise or Ultimate).
FR Cloud allows for filtering based on more aspects of request processing than the on-prem UI for FR, such as filtering by application name, or by request duration, and so on. And whereas the on-prem UI for FR tends to limit the number of items tracked to the most recent 100 (because that is tracked in memory on the app server), with FR Cloud such information is tracked in a database (in the cloud, managed by Intergral), which again greatly helps in assessing activity from one test to another. This includes not only request and database details, but also the request profiles and heap analysis information mentioned previously.
For more on FR Cloud, see such resources as: