

If you ever had some serious issues with the performance of your Java application, most probably you know how valuable thread profiling can be. But do you know which profiler you should use?
There are two basic techniques used by profilers – sampling and instrumentation.
Sampling Profilers
A sampling profiler involves periodically asking the JVM for the current point of execution of all currently alive (active) threads. This type of profiler carries the least amount of overhead. This is important because introducing heavy measurement/instrumentation into the application can change the performance characteristics significantly. Using a sampling technique, we get a snapshot of the next stack trace when the timer fires. So the profiler looks at each thread and determines which method the thread is executing at that moment. As there are gaps between consecutive measurements, sampling profiler achieves a trade-off between the level of accuracy obtained vs the overhead involved in actually taking the measurement, This is illustrated in the following figure:
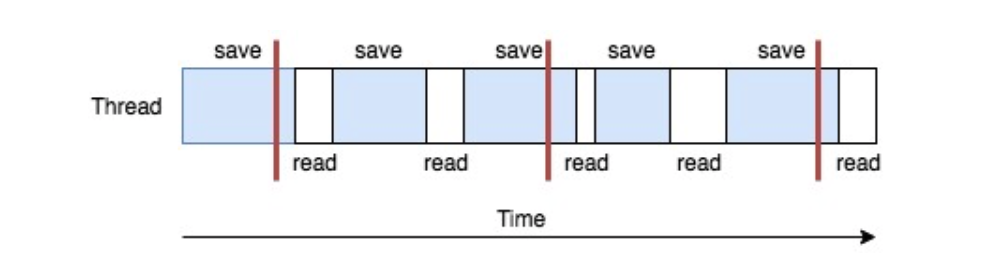
As you can see, the thread spent most of its time in save method and a little bit in read method. If the sampling happens only when the thread is in a save method (more probable as this method dominates), the profiler will report that the thread spent 100% of its time in save method, which is of course not accurate.
A rather logical way to minimize this sampling error is to reduce the time interval between sampling and increase the profiling time. However, as we discussed earlier, this solution might impact the performance characteristics of the application, so a balance is the key.
Instrumented Profilers
Instrumented profilers introduce a much larger performance overhead into the application. This method usually involves injecting bytecode into the classes for the purpose of profiling. This approach involves a higher performance impact, but generates a more accurate measurement when compared to the result from the sampling profiler. Another problem which may arise as a result of the way an instrumented profiler modifies the bytecode is the following; as you may know, JIT compiler inlines small methods. Because the instrumentation introduced by the profiler, some small methods might not be eligible to be in-lined anymore. It can have a serious impact on application performance. If you decide to use instrumented profilers, make sure that you instrument only a small section of the code.
Production Code Profiler in FusionReactor
Profiling in a development environment is easy. However, it might not be enough. When dealing with production data, we are exposed to a different scale and thus, we might observe different bottlenecks in our application. That’s why profiling in production is so important. As already mentioned, both sampling and instrumented profilers have their pros and cons. If you want to profile in a production environment, a low overhead sampling profiler seems to be a better choice. FusionReactor’s Production Code Profiler will help you identify bottlenecks in your production environment with a very low sampling overhead. The really cool thing about this profiler is that it can be configured in a way that it will automatically profile your application if it detects a long-running request or thread. What is a long-running request? It’s up to you to define, but 3 seconds is the default value. If you monitor some sort of latency-sensitive application, then you might want to decrease this value. Similarly, if your application performs some time-consuming computations, then most probably you don’t want to be notified all the time and increasing Minimum Transaction Time will be necessary. Taking a stacktrace snapshot takes as little as 1 ms per sample. With a default sampling rate of 200 ms, you can usually get some meaningful results from just 5 samples.
FusionReactor’s thread profiling output looks like this:
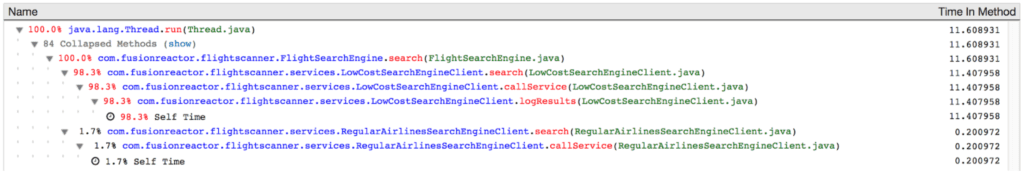
On the left-hand side, you can see the percentage of time the particular method took. On the right -hand side, time in seconds is shown. As you can see in the output, logging in lowCostSearchEngineClient class can be a potential bottleneck in this application. Thanks to the bundled de-compiler, you can instantly check the method by simply clicking on it.
It’s not always easy to pinpoint a performance issue in a running application, but profilers are usually good estimators. Sampling profilers such as FusionReactor’s Profiler, are perfect tools to use them in a production environment.