
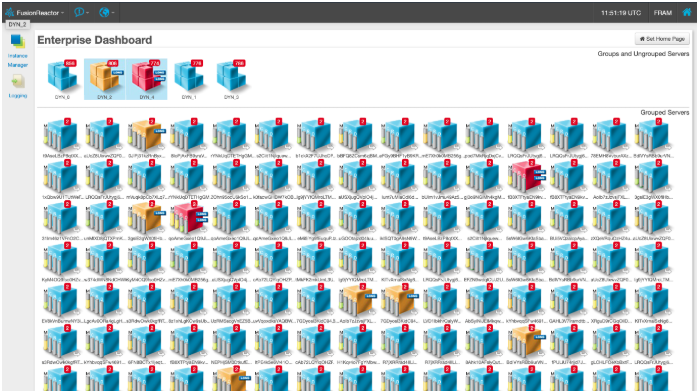
The Enterprise Dashboard lets you track the state of installations on one or more servers. When you install an Enterprise version of FusionReactor it can be queried for its current state. The Enterprise Dashboard lets you instantly monitor the health of ALL of your server instances/machines from a single window.
In FusionReactor 8.1 the Enterprise Dashboard has been enhanced, with support for ephemeral instances, making it perfect for dynamic scaling and virtualized servers such as Docker or Kubernetes.
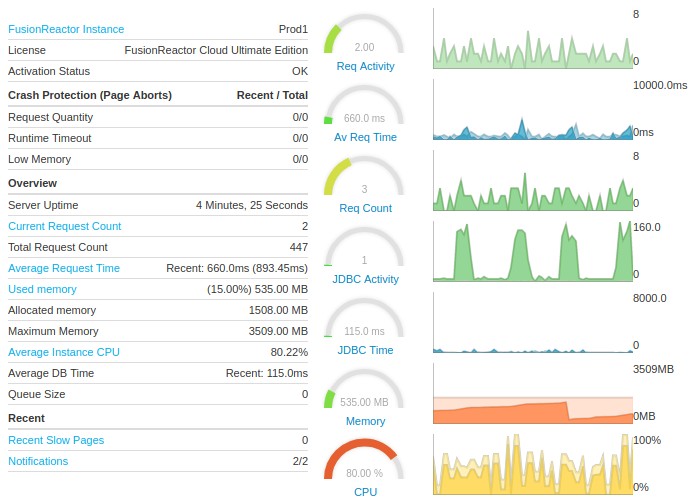
Quick access to instance data
Seven Gauge and Graph components are visible within the Enterprise Dashboard allowing you to immediately see the state of:
Memory, CPU, Database and Requests Activity/Averages – these values are updated every 5 second
Flexible Alerting
FusionReactor has indicators, which will highlight warning and critical status levels for many of the server metrics being monitored. You can set your own threshold levels and once entered, the machines will now visually attract your attention when something is wrong.
When FusionReactor detects a problem on a monitored server it will light up one or more “Warning Lights” on the server cube. You can mouse over a warning light to see a tooltip explaining the problem in more detail.
Designed to cope with large auto-scaling environments
Our enterprise Dashboard supports registration for ephemeral instances, meaning you can add FusionReactor instances hosted in the cloud, in docker or any other environment automatically when they start. When your instances connect a tunnel is established between the dashboard and the instance, meaning you can access the user interface of the FusionReactor instance without needing to configure access rules.
The Dashboard is fully scalable, so you can easily run a single dashboard with hundreds of groups and thousands of instances connected simultaneously.
For a full guide on configuring your dashboard for any environment see Configuring multiple servers in a single dashboard
Server Status
The server icon shows four bars. These bars each have a letter above them (M,C,R,D) to indicate what is being displayed. These bars are:
- (M) Memory : represents the amount of memory currently being used by this server.
- (C) CPU : represents the amount of CPU time used by this instance since the last CPU value was measured. It is expressed as a percentage of the total CPU time (across all CPU cores) that was available during that period.
- (R) Request Time : represents the average request time on this server over the last 60 seconds.
- (D) DataBase Time : represents the average time spent on DB operations in the last 60 seconds.