OpenTelemetry and FusionReactor together provide comprehensive visibility into distributed applications. OpenTelemetry enables easy code instrumentation for tracing, while FusionReactor offers end-to-end monitoring and troubleshooting.
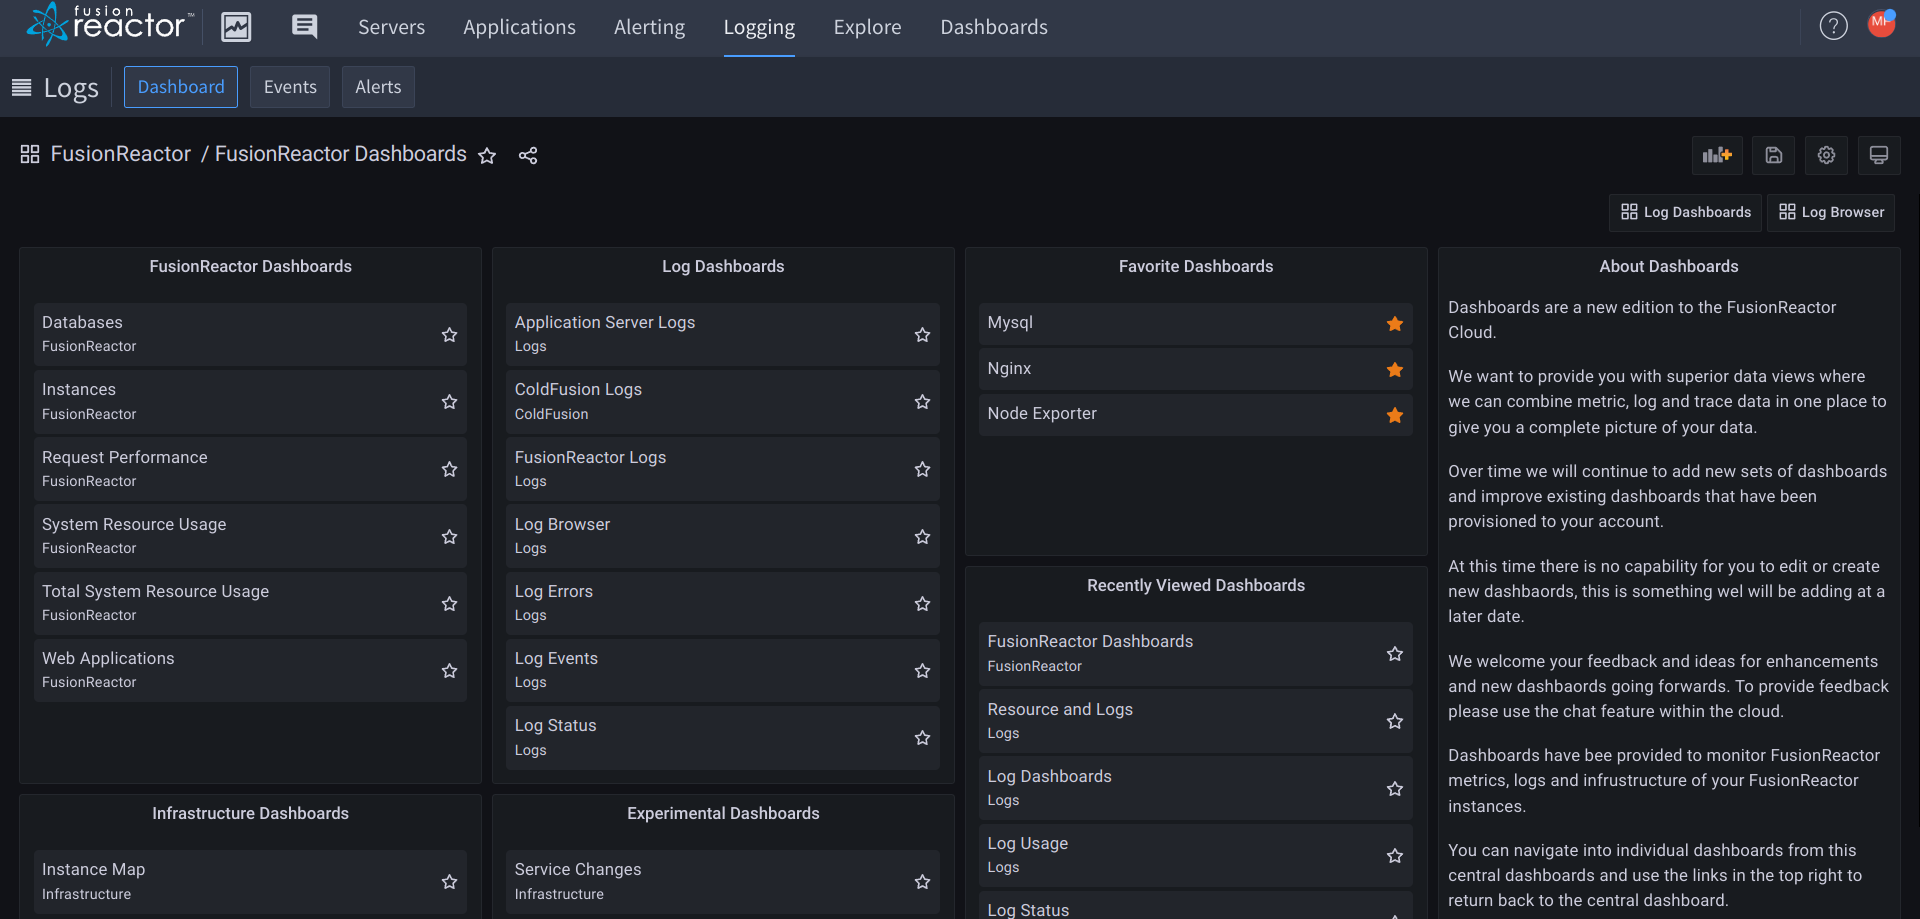
End-to-end
End-to-end application monitoring
- Monitor requests from services, serverless functions to databases
- View traces and logs in context.
Real-time
Real-time control and visibility
- Real-time visibility into ingested traces and services
- Discover errors and latency outliers.
INSTRUMENTATION
Any stack, anywhere
- Instrument any application
- Integrate hundreds of third-party frameworks or libraries.
Root cause Analysis
Identify root causes at code-level
- Always-on, low-overhead code profiling.
- Reduce service latency.
Supported Technologies


Ready to optimize your applications and solve your problems?
Get and ento to end view
- Unlock distributed tracing power with FusionReactor APM’s OpenTelemetry integration.
- Trace requests, identify bottlenecks, and optimize performance across distributed systems.
- Gain deep visibility into request flow and dependencies for enhanced application architecture understanding.


