Easy to use
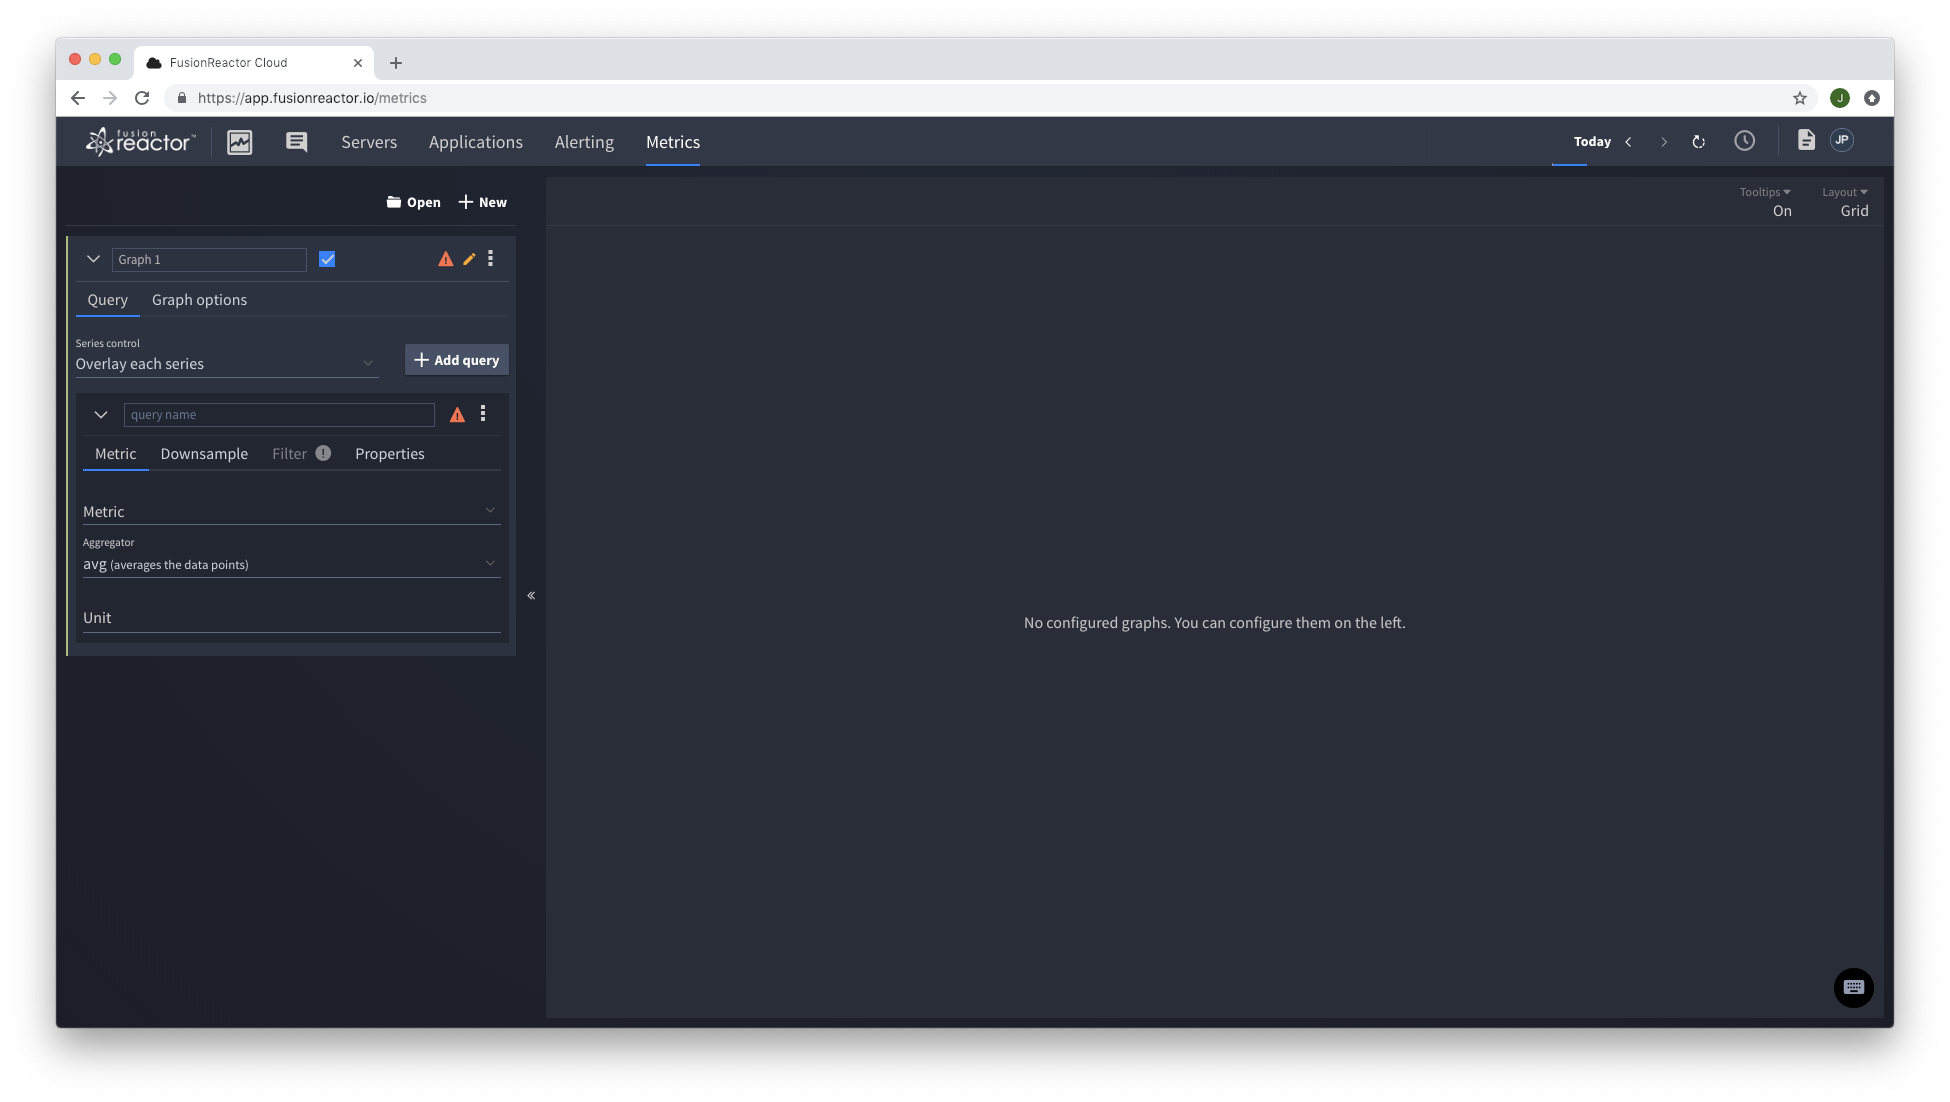
Using the Metrics Explorer inside FusionReactor Cloud allows you to begin examining all of the metrics FusionReactor has collected from your instances or application.
On the left of the screen, you can see the query configuration panel, this allows you to configure the queries used to generate the graphs that will appear on the right-hand side of the screen.
Clicking the metric dropdown shows a searchable list of all of the metrics available for your account.
Aggregate data
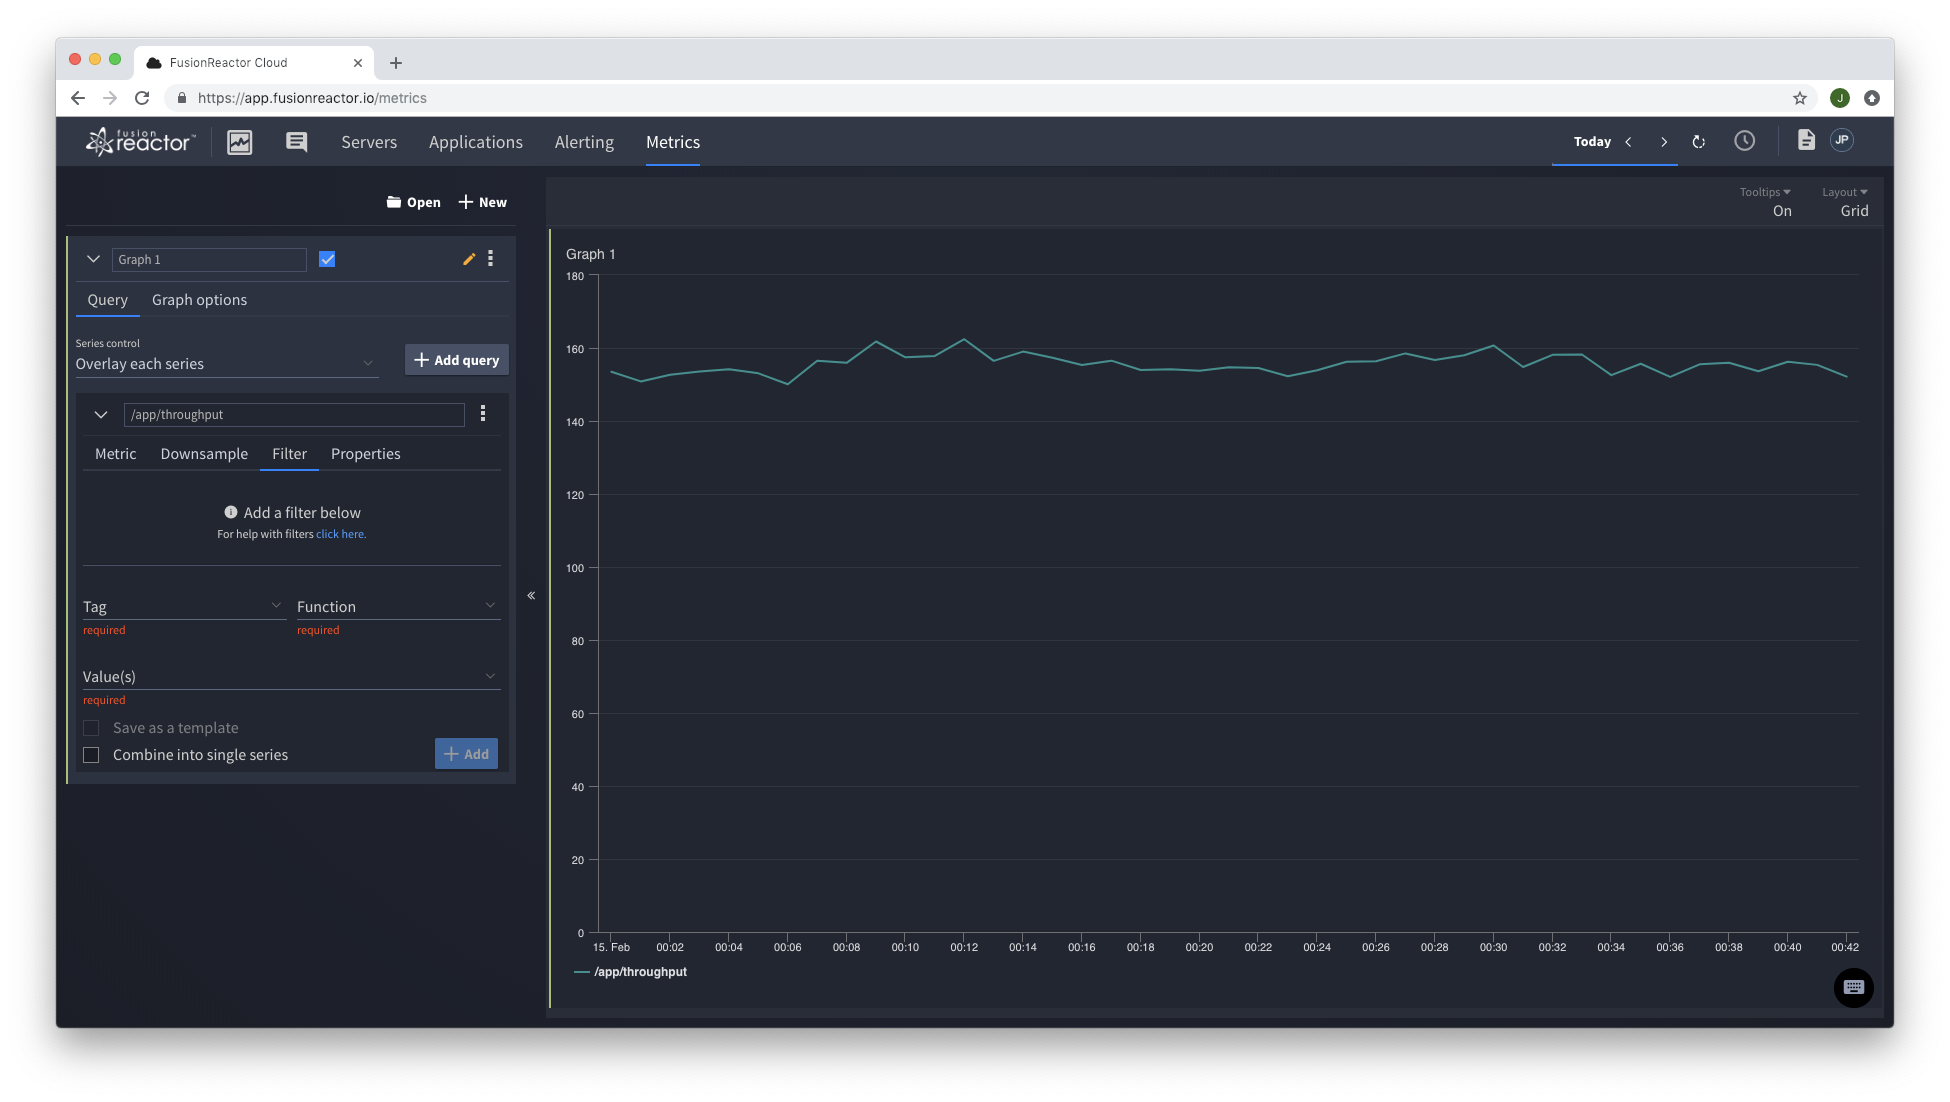
In the example we are looking at the application throughput metric, once this metric is selected a graph displaying this metric is automatically generated. By default this graph shows an aggregation of all of the available data in the system for that metric (from all instances and all applications).
Instance data
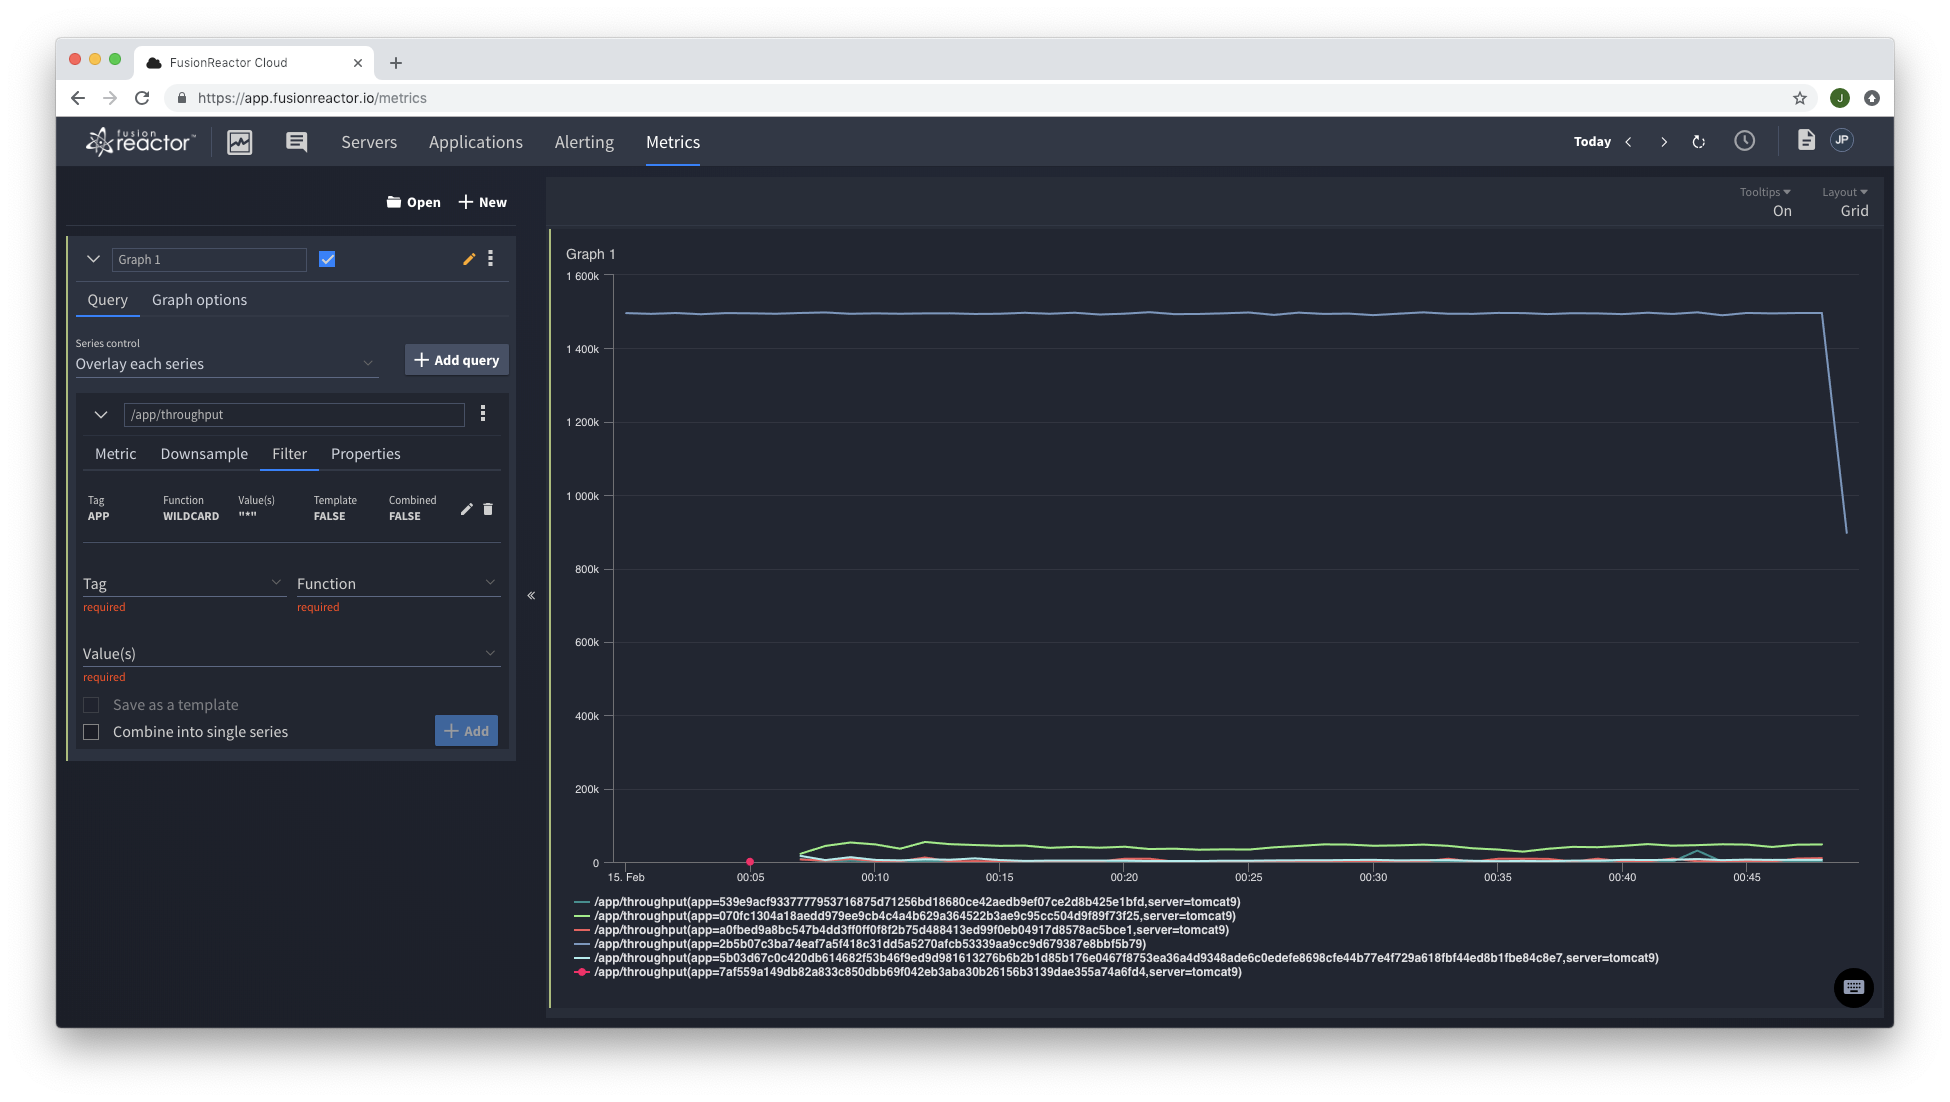
From here we can now edit the previous filter to a ‘literal_or’ and select a particular application whilst adding a further compound filter to now split by instance. Now we have a graph showing the throughout of the FusionShop application broken down by individual instances.
Create your own dashboard
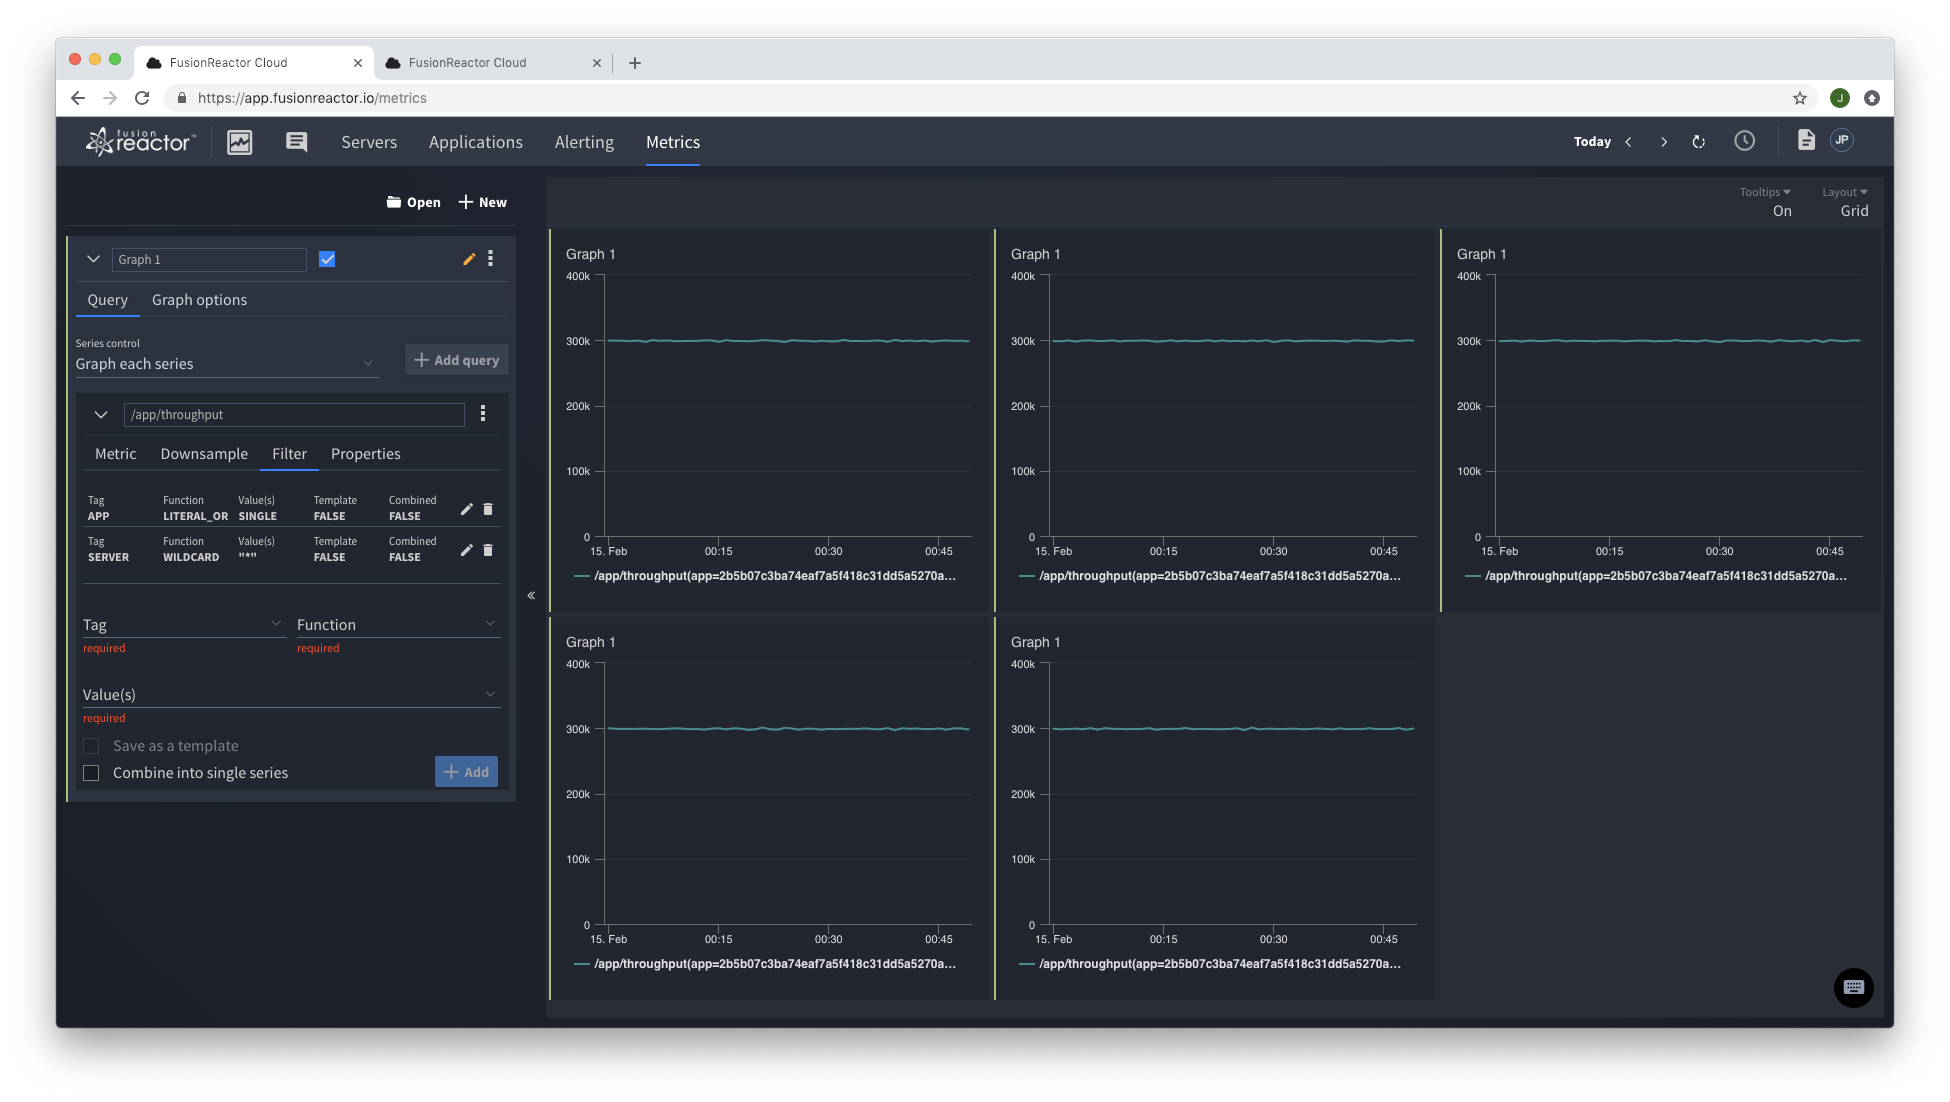
Finally, using the series control dropdown it’s possible to generate individual graphs for each instance to create a dashboard type overview of instances running the FusionShop application.