
Find issues 50% faster
The recent Dzone Performance guide tells us that “36% of developers have to solve performance problems every single week and they spend between 11 and 30 hours to actually identify the problem”
What needs to change? Two things – introduce performance analysis into the Software Development Life Cycle (SDLC) and provide developers with real-time DATA and CODE insight into what’s happening at the point that things are actually breaking – in production.
74% of software engineers using FusionReactor Ultimate have reduced Mean Time To Repair “MTTR” to less than 4 hours
Ongoing Customer satisfaction survey 2020 – 2021
FusionReactor Ultimate includes a suite of low overhead, production-safe, and secure analysis tools. Including automated error detection, production runtime tracing and debugging capability, and useful performance profiling tools, including a code, thread, CPU, and memory profiler.
These tools provide developers and DevOps with a unique level of insight into what’s really happening in production as issues and performance problems unfold. This capability will ensure that issues can be addressed and fixed in the shortest possible time.
Why upgrade to Ultimate?
- Improve the measurement of software maintenance productivity and efficiency
- Lower the impact of technical debt on your team
- Instantly see what’s causing critical production issues
- Dramatically shorten the Mean Time To Know (MTTK) by utilizing our Deep Code Insight
Halve the time searching for performance issues
Continuous code profiling highlights performance issues as your application executes.
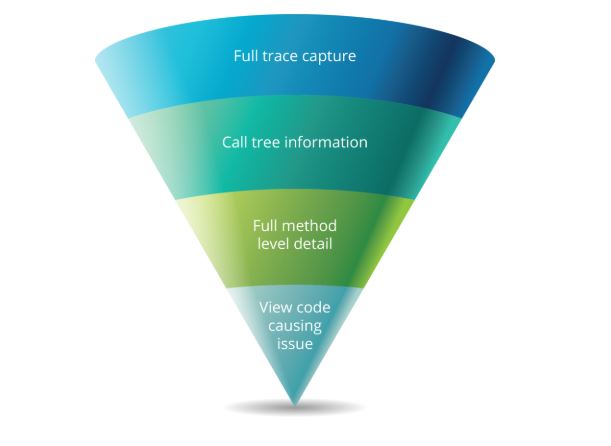
See full stack trace and method execution time using Deep Code Insight
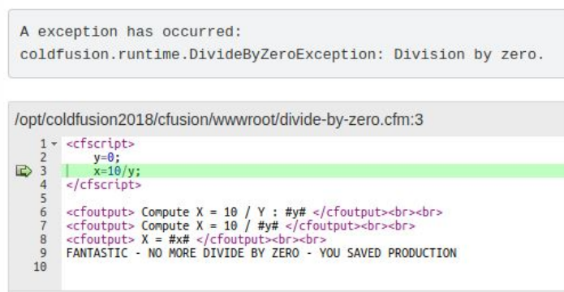
Instantly see the cause of critical issues as they happen
Automatic Error Detection and Production Debugging shows you the exact code, stack trace, and variable context at the point that each error occurred
Realtime heap analysis allows you to immediately spot potential memory leaks
Real-Time heap analysis provides in-depth insight into potential memory leaks and excessive object creation as well as GC Roots analysis
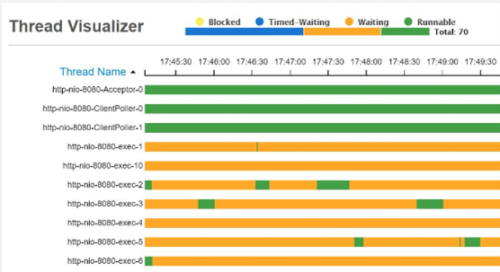
Increase performance and free up resources by identifying stuck or expensive processes, thread contention, and deadlocks
Detect thread contention and dead-locks and see how much CPU has been used by individual threads. Running threads can be instantly profiled or have a stack-trace dump generated

Download our FusionReactor Ultimate fact sheet PDF