
These developer-centric features often enable you to reduce your Mean Time to Repair by half. They are only available on the Ultimate and Developer editions. The Ultimate edition is available with On-premise or SaaS UI’s. Try Ultimate for yourself by starting a free trial
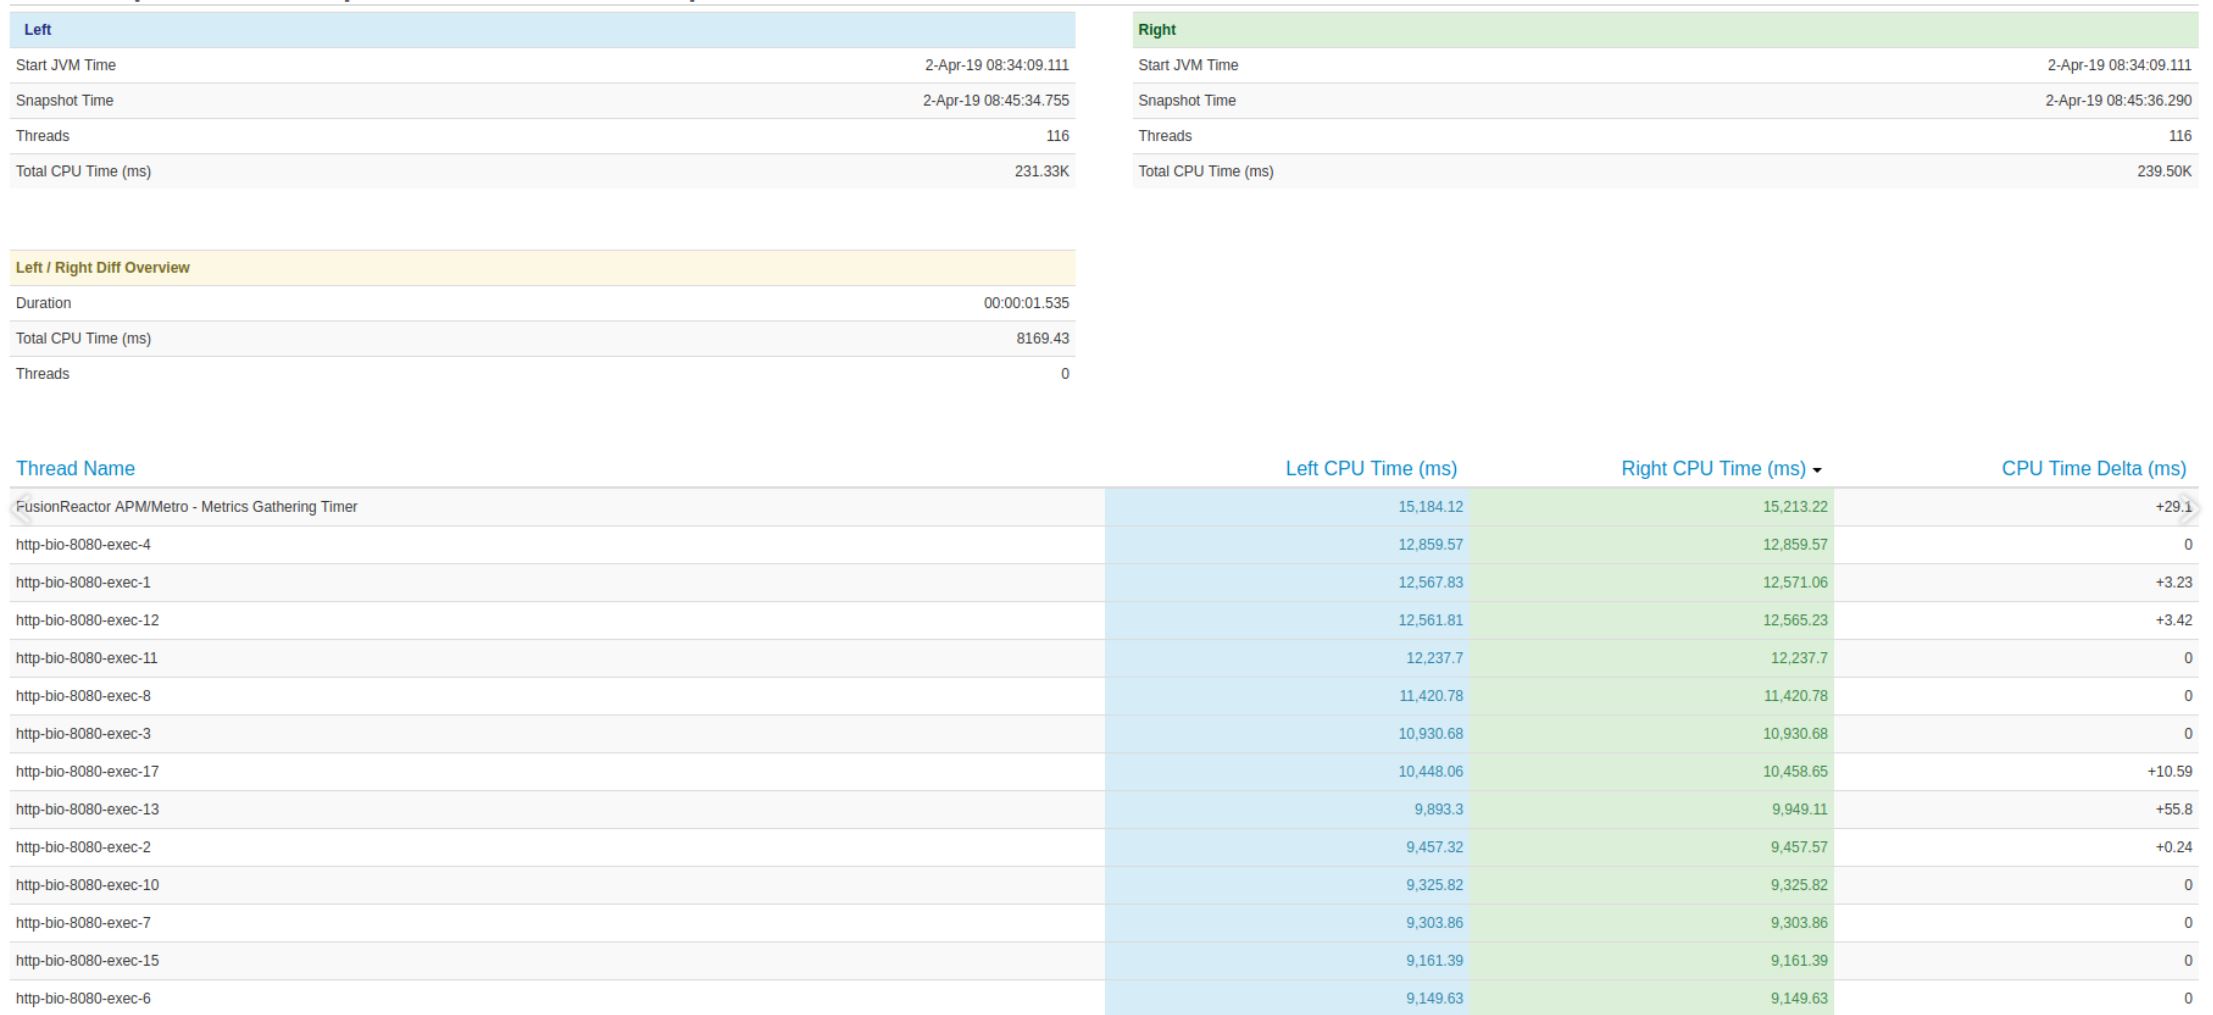
Compare CPU Snapshots
Take point-in-time snapshots of the CPU sampler and compare these snapshots to analyze thread performance over time. Identify the threads that can be made more efficient and use the profiler or debugger to improve performance.
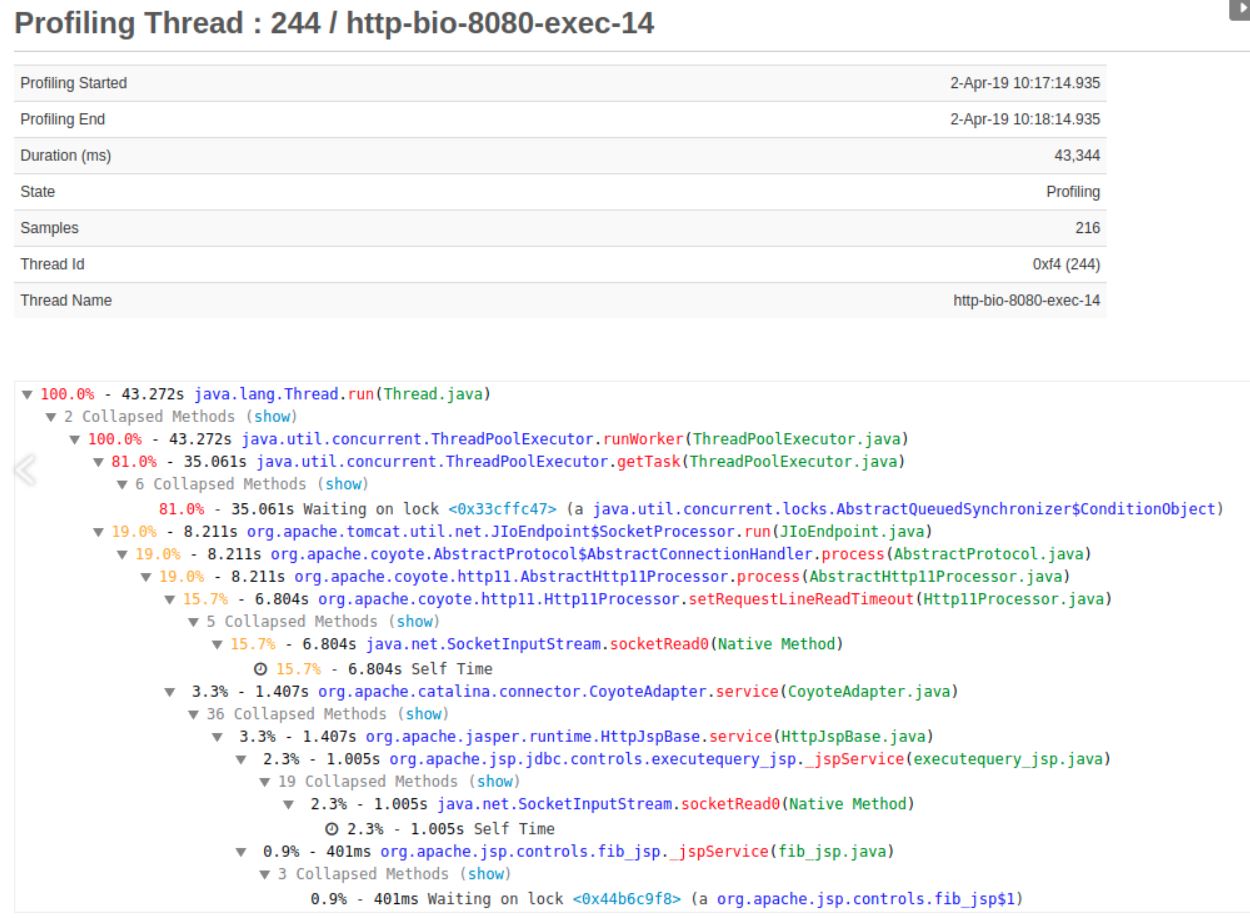
Profile inefficient threads
Take a profile of a thread using the integrated low-overhead Java Profiler to see the code being executed and get a clear picture of what functions a thread is running that could cause a slow down in performance.
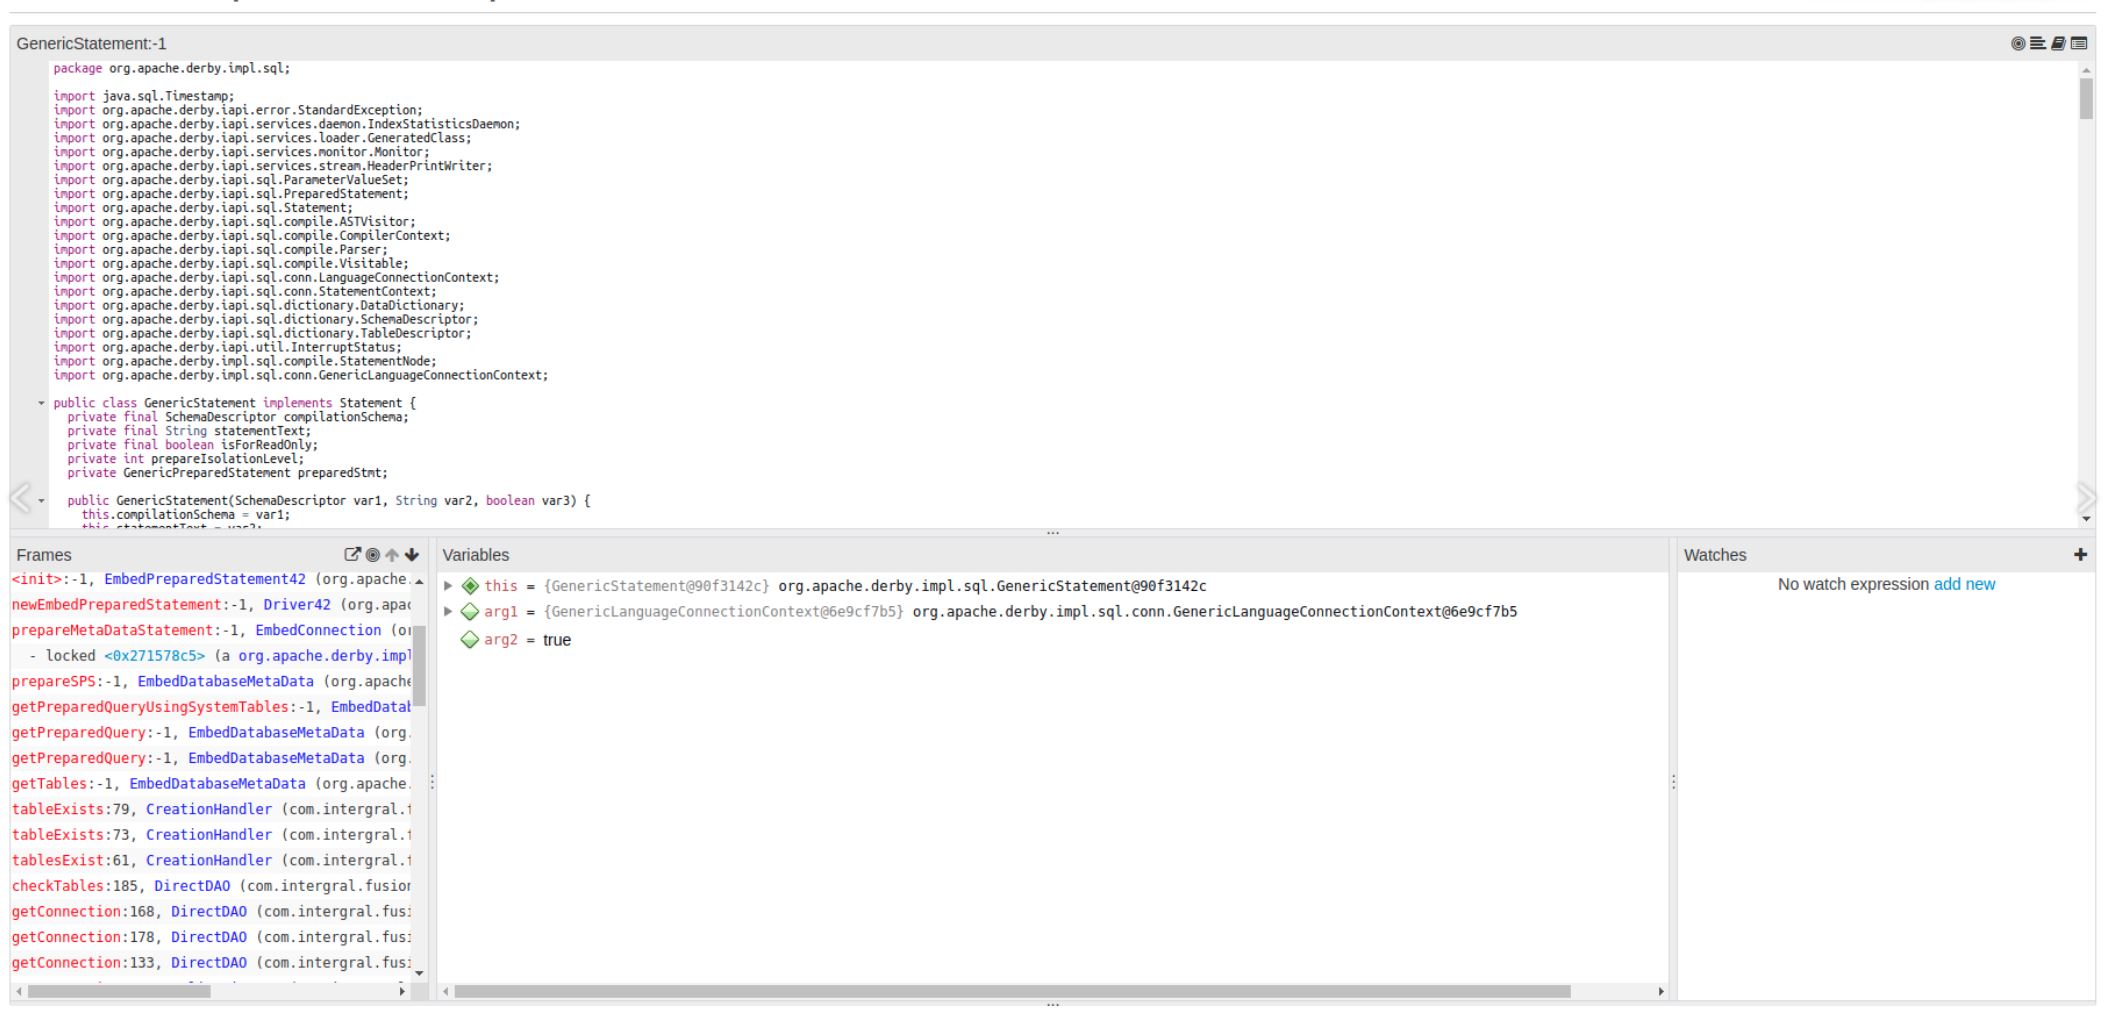
Pause threads to debug instantaneously
Pause a thread during execution and use the FusionReactor Debugger to view the frames and variables within the stack of the running thread.