
These developer-centric features often enable you to reduce your Mean Time to Repair by half. They are only available on the Ultimate and Developer editions. The Ultimate edition is available with On-premise or SaaS UI’s. Try Ultimate for yourself by starting a free trial

Search and Filter Running Threads
Use the search feature to quickly filter across all running threads, enabling you to instantly isolate thread anomalies.
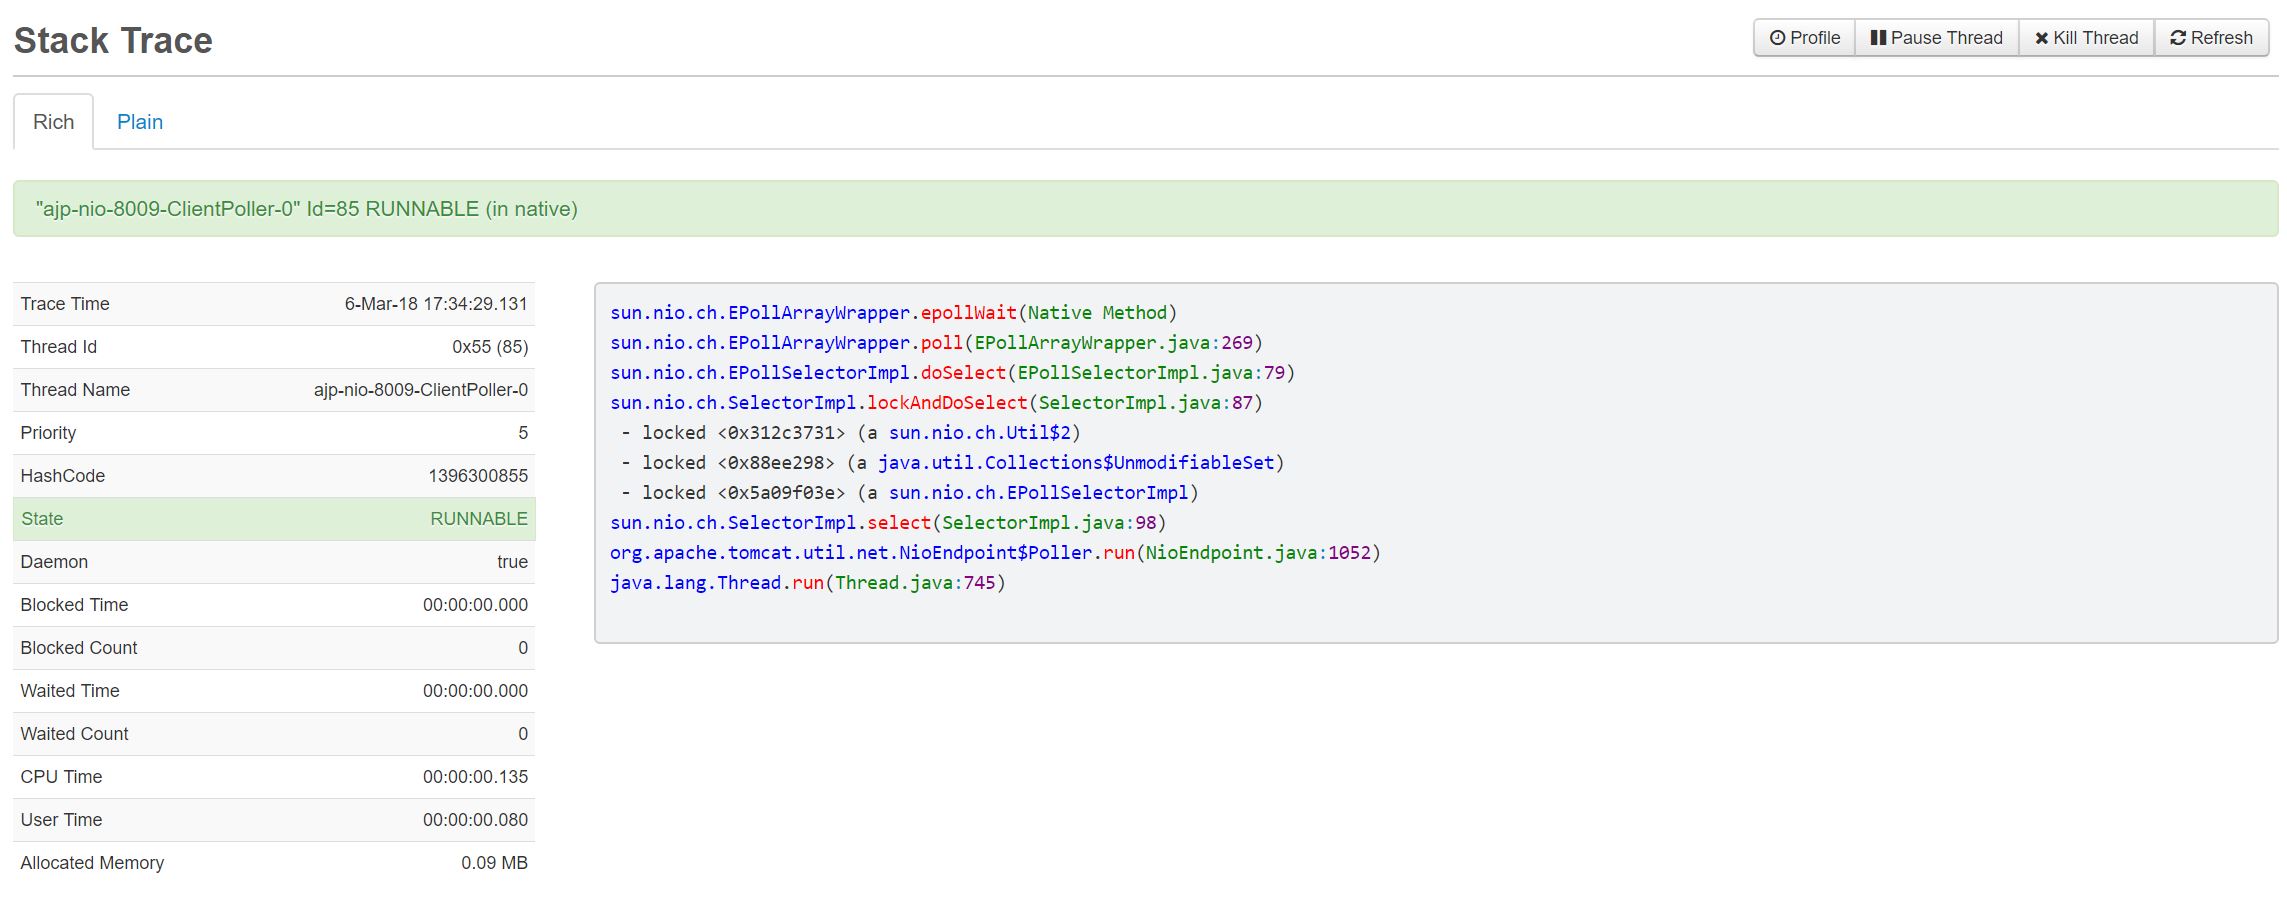
Instantly Stack-Trace Running Threads
Clicking on the Stack-Trace button, adjacent to a running thread, will instantly generate a stack trace (as can be seen in the current view). Classes are highlighted in BLUE and methods are shown in RED.
These links are active and when clicked, will result in the class/method being instantly de-compiled
Find out more
Watch our short video on how to use FusionReactor to track down high CPU threads and what code they are running.