These developer-centric features often enable you to reduce your Mean Time to Repair by half. They are only available on the Ultimate and Developer editions. The Ultimate edition is available with On-premise or SaaS UI’s. Try Ultimate for yourself by starting a free trial
Low-Level Memory Profiling
See inside the heap in real-time with our JVM performance tool. Objects are displayed as an absolute number and as a percentage. The bytes allocated are also displayed as a graph representing the percentage of bytes as well as the total number of bytes allocated by each class.
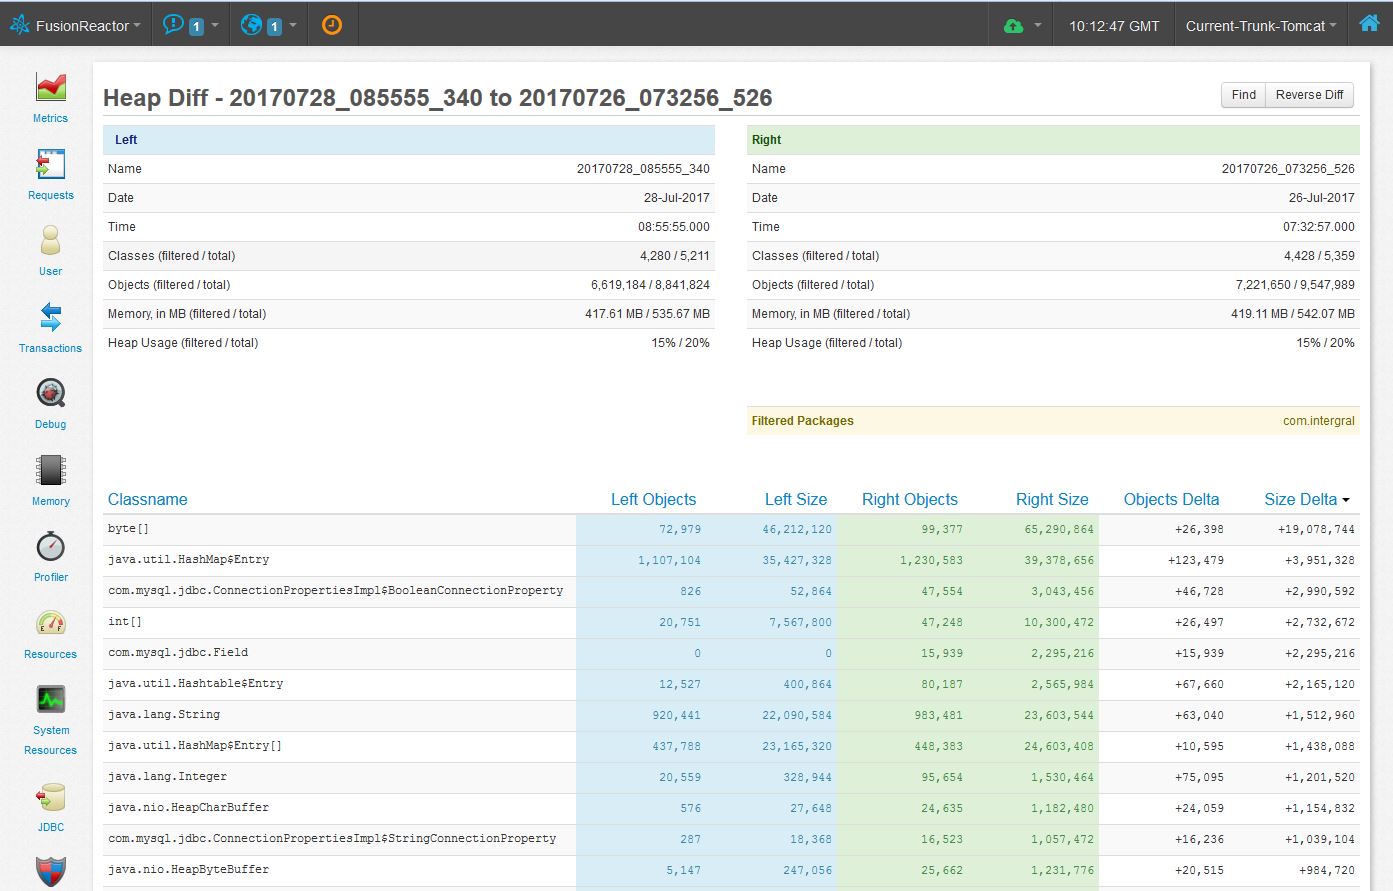
Compare Heap Snapshots
Quickly spot memory issues by using the Memory Profiler to take individual snapshots of the heap and save these locally. A memory snapshot captures profiling data on allocated objects. Snapshots can easily be compared and differences highlighted to analyze memory usage
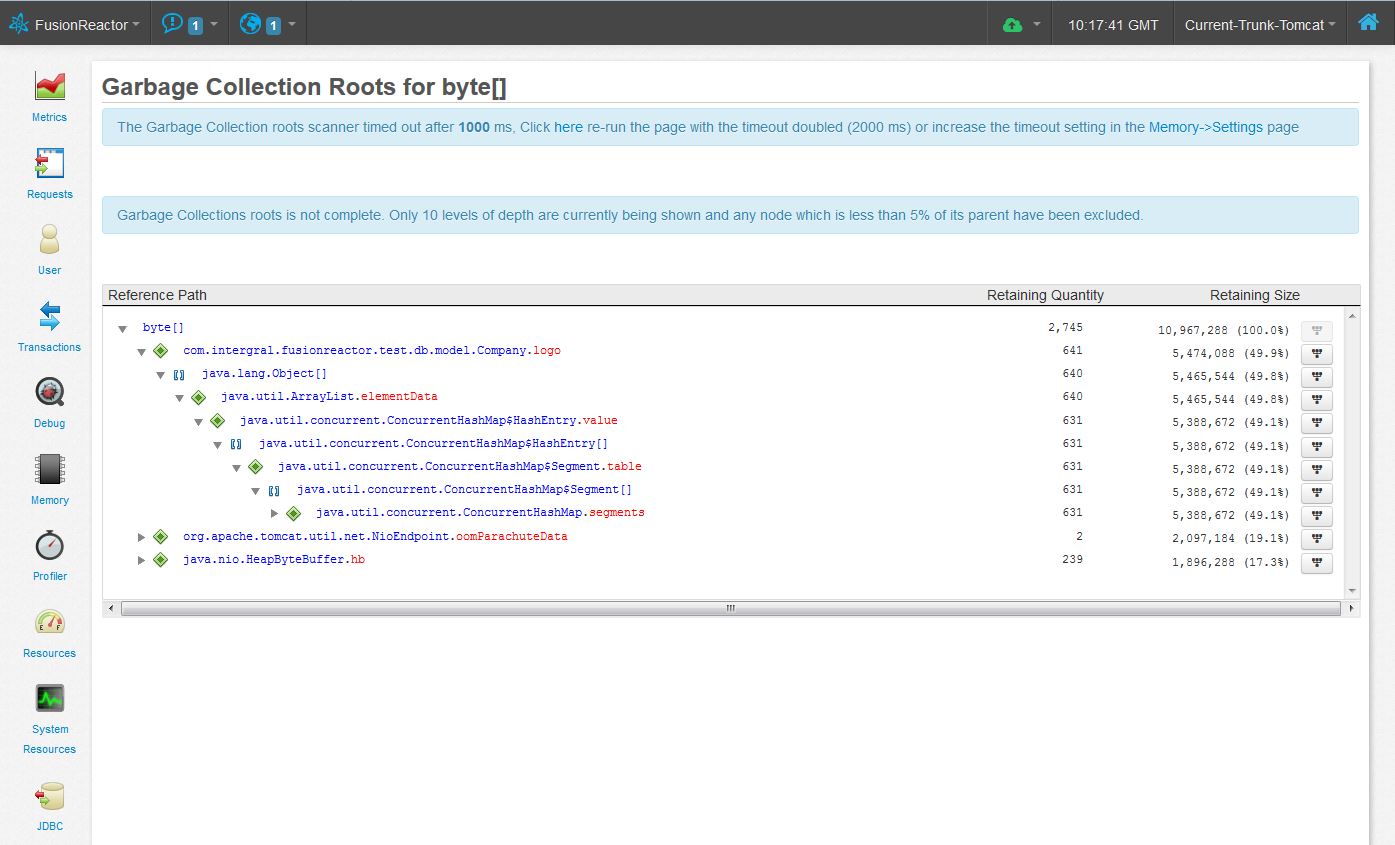
Analyze GC Roots
Identify memory leaks, using the GC Root analysis feature. A Memory leak is achieved when an object retains memory and cannot be collected because they are referenced from other live objects (due to a defect in the application). Every leaked object is accessible from at least one GC Root or is a GC Root. Each leaked object has a path that starts with GC Roots and contains (ends with) the leaked object.