

APM tools have emerged as a category to help businesses address issues when applications break or systems are slow. Unfortunately, even though many of those tools measure metrics and provide some insight into what’s going on, they don’t do anything to minimize downtime and really accelerate time to fix. To be honest, traditional APM tools simply don’t do enough.
FusionReactor 6 takes a different approach – we not only provide the basics and core APM expectations that every user has for server monitoring, FusionReactor 6 introduces the unique and patented capability that allows you to do real-time Production Debugging, a game changer in accelerating the time needed to IDENTIFY and FIX issues – PLUS FR’s unique Crash Protection, which will alert you and guard your servers against crashes, so you can take action BEFORE systems go down – resulting in high application and server resilience, improved quality, less downtime and happier customers !
FusionReactor 6 is breaking the mold of traditional APM tools and will enable you keep your production systems online longer and with better results.
Here are some of the highlights which you can you expect with FR6:
|
|
|
Production Debugging/Alerting
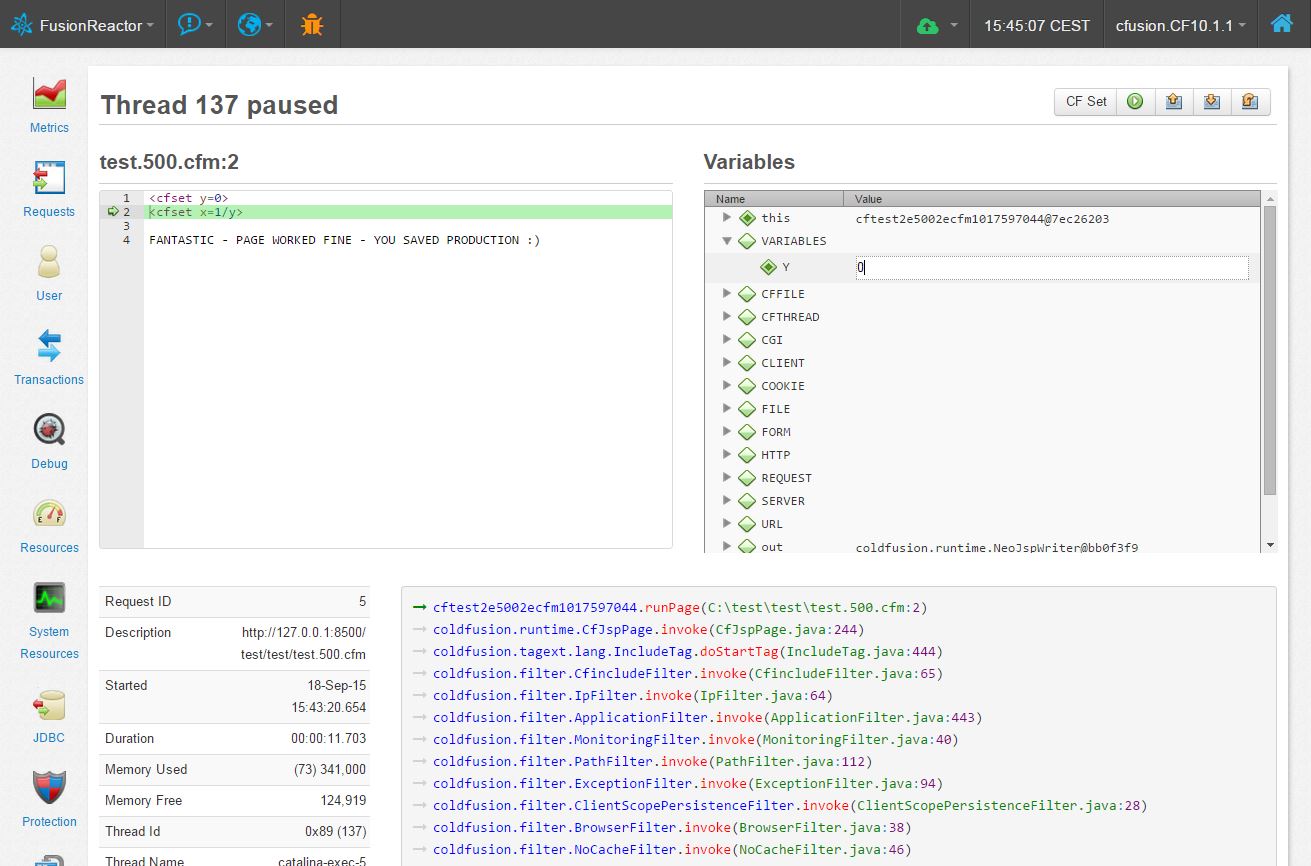
Did you ever hear someone say, “We can’t reproduce that problem, it ONLY ever happens in production” – well, with the introduction of FR6’s new Production Debugging (PD) capability, this will become a thing of the past.
Production Debug gives you all the control you need to simply and securely interact with your production environment as issues unfold. The insight it provides will revolutionize how you identify problems. Unlike a typical debugger, you can setup conditional breakpoints and be alerted by email when they fire. The email will contain a link to the debug session, as well as stack trace and variable details at the instant the break point fired. It has NEVER been easier and faster to get to the root of issues.
The Production Debug feature will only be available in the new FusionReactor Ultimate Edition.
[column width=”eight” position=”first”] Key features include:- Interactive debugger within FusionReactor’s interface
- Conditional breakpoint (BP) and break on exception handling – allowing full control of debug sessions in your production environment
- Usual debug features e.g. alter variable, step into, out etc.
- Email breakpoint notification – when a breakpoint fires, FusionReactor will hold the thread and send you a link to the debugger at that point. Restricting this to a single thread ensures that your production environment is not impacted by the Production Debugger
- Time controlled handling mechanism, allowing you to easily control how your production system handles break points / exceptions / debug sessions
- Exception Alert Email – including Stack trace + Stack context – will enable rapid identification of issues
- Visual indication (in the FR banner) that a Production Debug trigger has occurred

System Monitor
Over the years, customers have often asked for other system related metrics which were usually only available in more traditional system monitoring tools. We have now extended FR6 to include a wide range of new metrics and system specific information. Access to this information is via the System Resources icon in the main FusionReactor interface.
The new metrics being tracked, include:
|
|
|
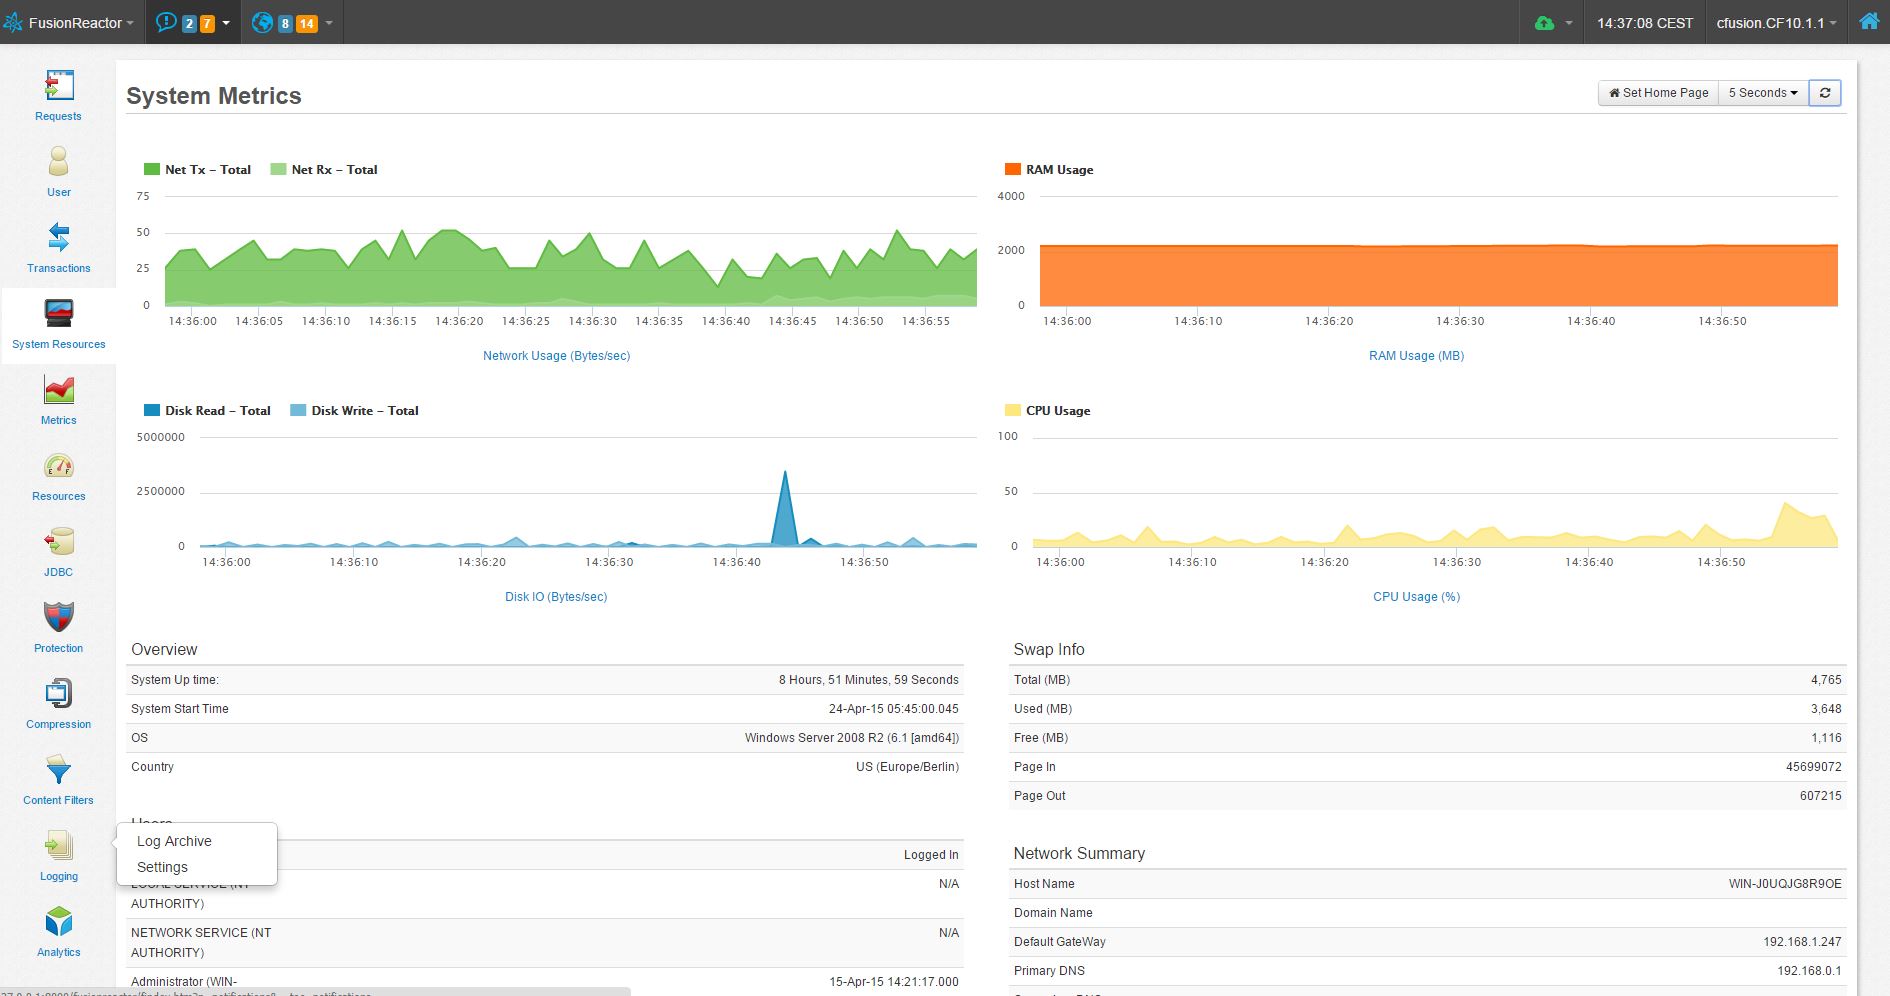
Another important feature is the ability to set disk space thresholds, so now FusionReactor can alert you when disk space reaches a defined limit.
New FusionReactor Reports
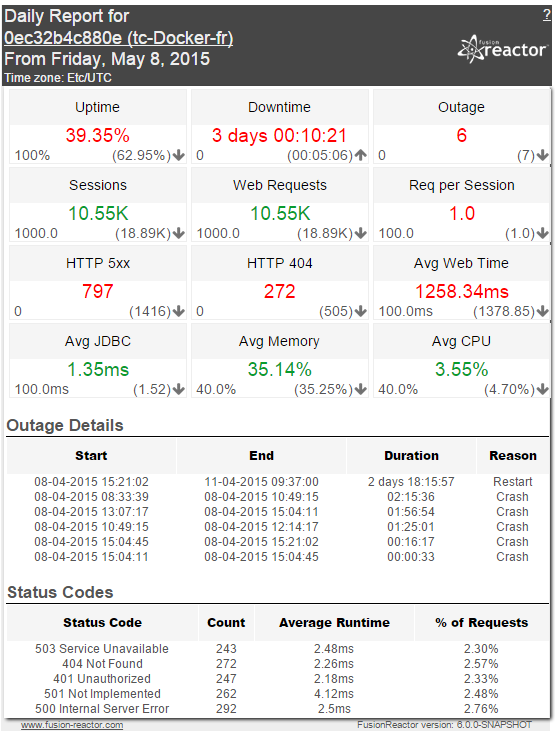
Feedback to the original FR Daily Report was really positive and we wanted to build on that with our new Daily Report, which adds additional information and draws your attention to potential issues and/or improvements in performance and stability. The new layout includes both previous values, and targets for those values. We think that this will allow for a better overview of how your server is doing on a day to day basis.
We have also added some more statistics to the report including number of sessions and number of 404 errors. In addition to these metrics we have added a breakdown of the recorded outage, with estimated start and end dates and times, durations and the reason for the outage. We also now have a breakdown of all response codes for the reported period, with average runtime, count and its percentage out of all requests.
Along with the Service Level report, we are introducing a Weekly report, which will produce a summary of your server for the week, as well as a monthly report, which will produce a summary of the calendar month.
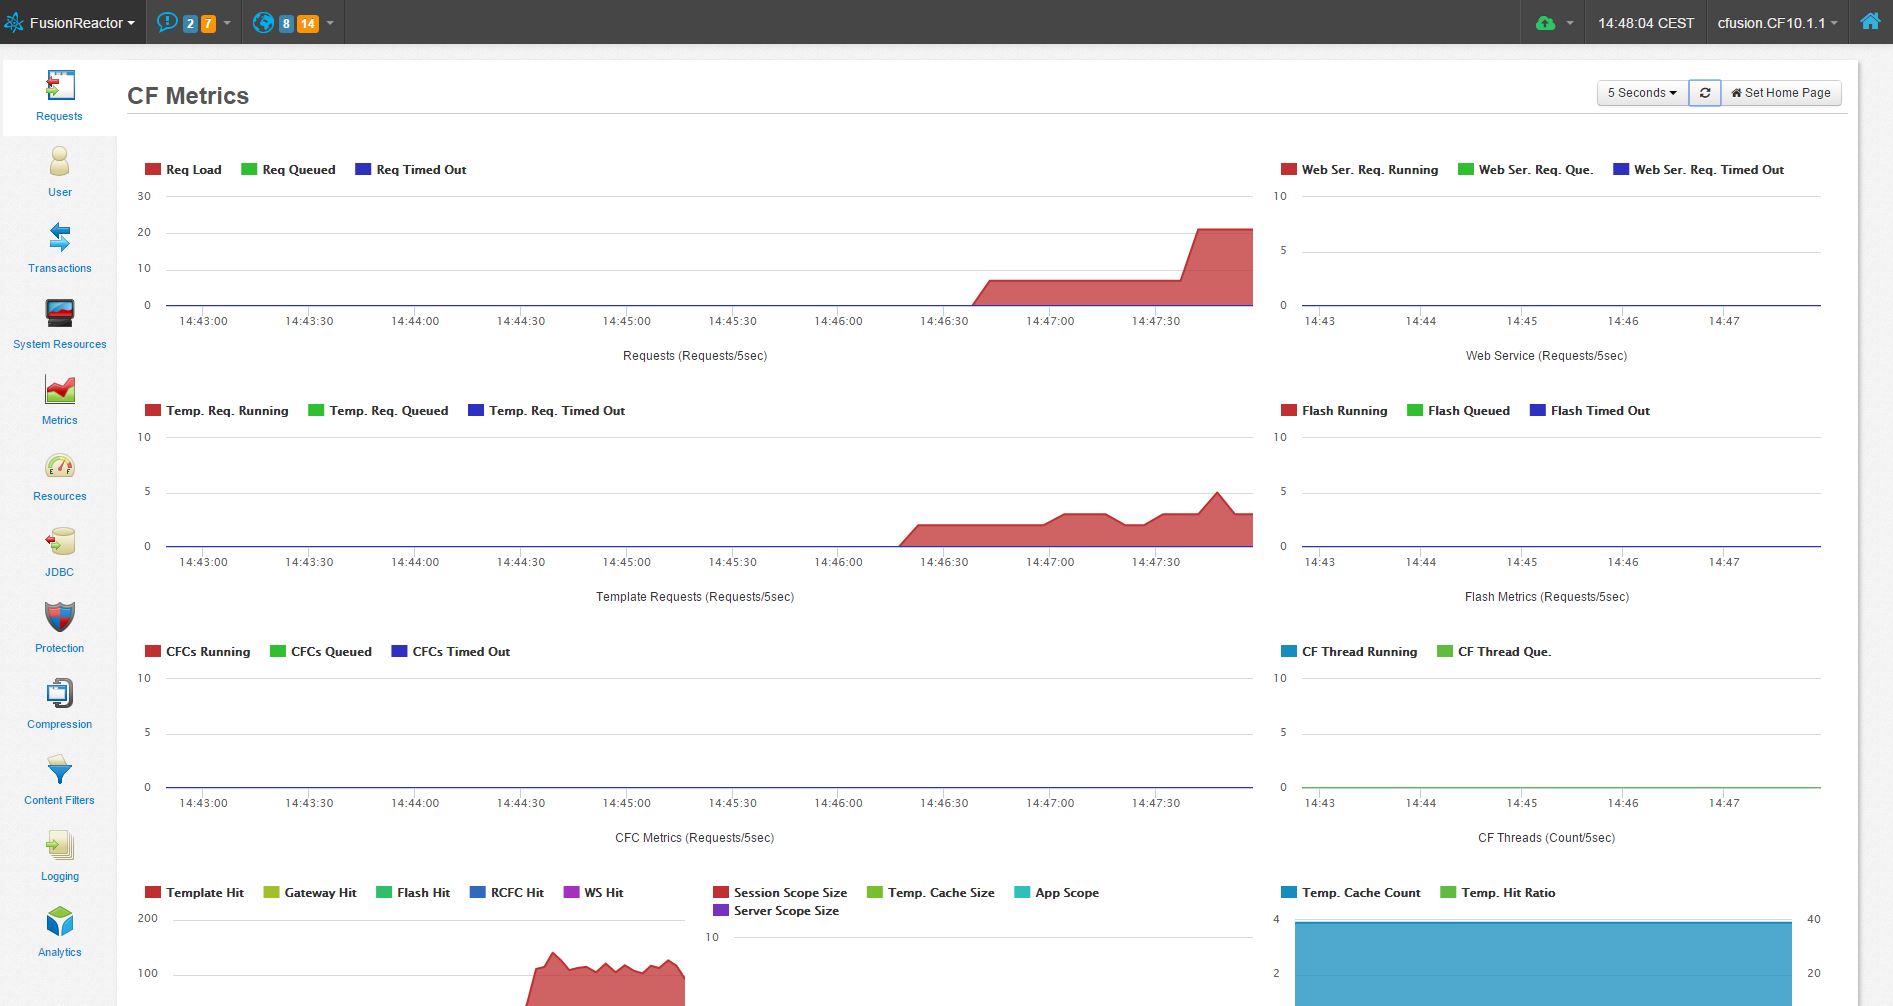
ColdFusion Metrics Page
FR5 already collected a number of specific ColdFusion metrics. Till now, these were stored in various log files and were only available visually via FusionAnalytics. FR6 has 2 new screens available which break down the CF metrics and display them in graphical form. Some of the metrics shown, include : Active Sessions, # of current sessions, Template Requests, Web Service requests, App Scope Size, hit counts (breakdown of hits per request type) etc.
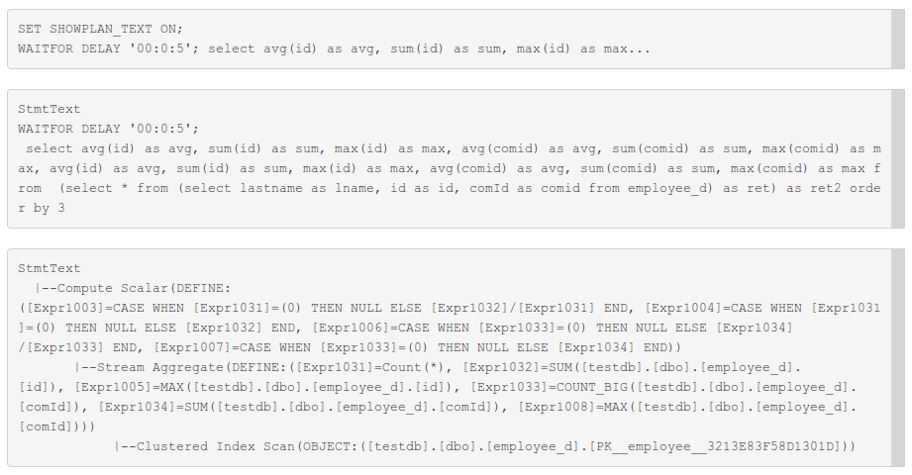
SQL – Query Plan (Explain)
Since SQL is declarative language, there are typically a large number of alternative ways to execute a given query. These alternatives can provide widely varying performance. JDBC is typically one of the main areas which we find at the root of application related performance issues.
FusionReactor 6 has the capability to attach an SQL Query Plan to the given JDBC transaction in the event that the SQL statement execution is longer than a given time. This is made available on the transaction details page. This feature will provide database users and administrators the capability to manually examine the plans produced by the optimizer to spot potential performance issues. FusionReactor will run the query plan immediately after the actual query is executed.
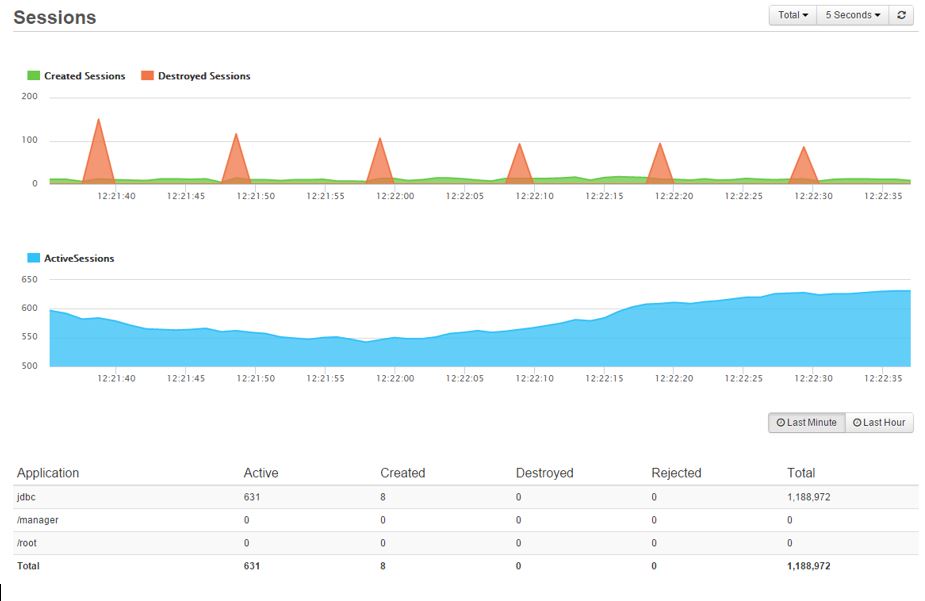
Session Tracking and Visualization per Application
In the stateless HTTP web world, Session’s play an important role for maintaining client state. Sessions are generally used to store user data – which can quickly eat up memory if not kept in check. Sessions are tracked (and identified) using a session ID. FR6 is now tracking and visualizing sessions. All created, destroyed and active sessions are tracked per application.
[/column]