
These developer-centric features often enable you to reduce your Mean Time to Repair by half. They are only available on the Ultimate and Developer editions. The Ultimate edition is available with On-premise or SaaS UI’s. Try Ultimate for yourself by starting a free trial
Instantly Find Performance Bottlenecks
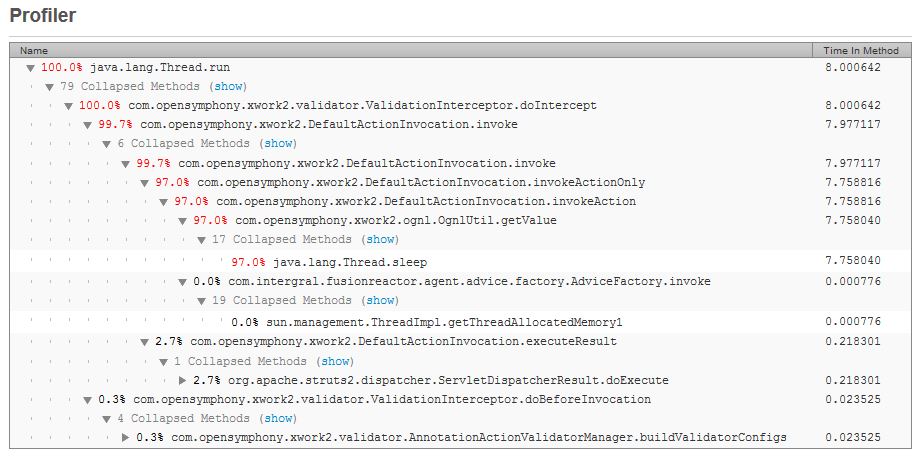
The Code Profiler is a low overhead performance analysis tool, which can be easily run in your production environment. Profiling occurs automatically, so you will never miss an issue.
Low-Overhead application performance profiling
FusionReactor Ultimate Edition includes an integrated low-overhead Java Profiler – which is the perfect tool for identifying poorly performing code in your production environment.
You can profile any requests or transactions which are running on the JVM – e.g. Tomcat, JBoss, WildFly, Glassfish, Jetty etc. ColdFusion applications can also be profiled.
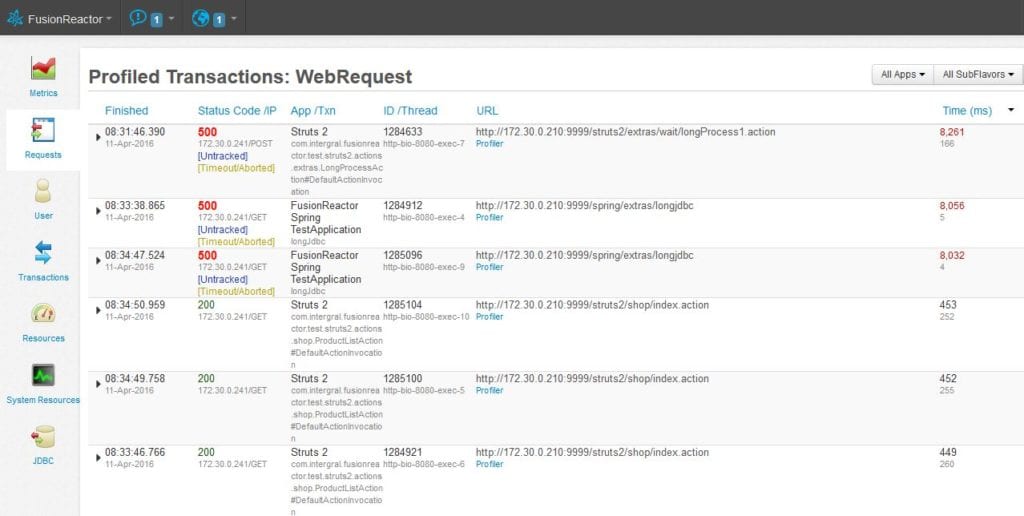
Automatically Profile Problem Requests
When the Profiler is enabled, request and transactions will be automatically profiled and stored so you can analyze them at your leisure.
You can also start profiling on-demand – giving you full flexibility.
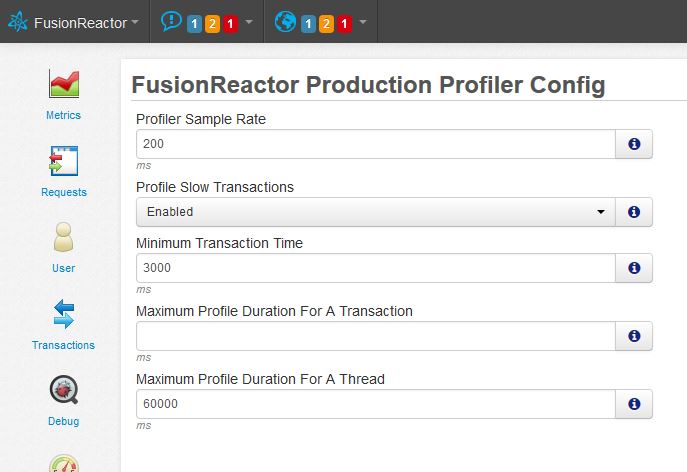
Low Overhead application performance profiling
The Production continuous Profiler is designed as a low overhead tool, which can be easily run in your production environment. Simple to configure, you can decide whether the Profiler should run automatically and under what conditions e.g. Profile requests or transactions when they have been running for a set period of time. The number of profile samples taken can also be limited, enabling you to control the level of accuracy of the sample.