
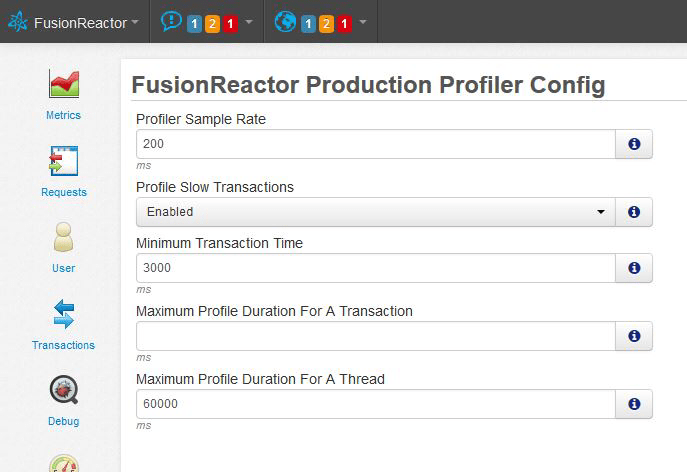
Fig 1. Continuous Profiler alerting configeration Memory affects everything; therefore, it is critical to be able to pinpoint memory issues throughout an application development life cycle. One of the most useful functionalities of continuous profiling is that it can show us how much memory was allocated for a specific transaction or web request. With continuous profiling, you can actively track memory and subsequently optimize memory usage. This allows developers to get an instant insight into the heap in their production java applications with low overhead memory. Also, having a wider overview of how specific threads are running is essential to understanding performance syntax. A continuous profiler provides an interface where users can instrument individual threads in order to get to the root cause of the stability of performance-related issues.
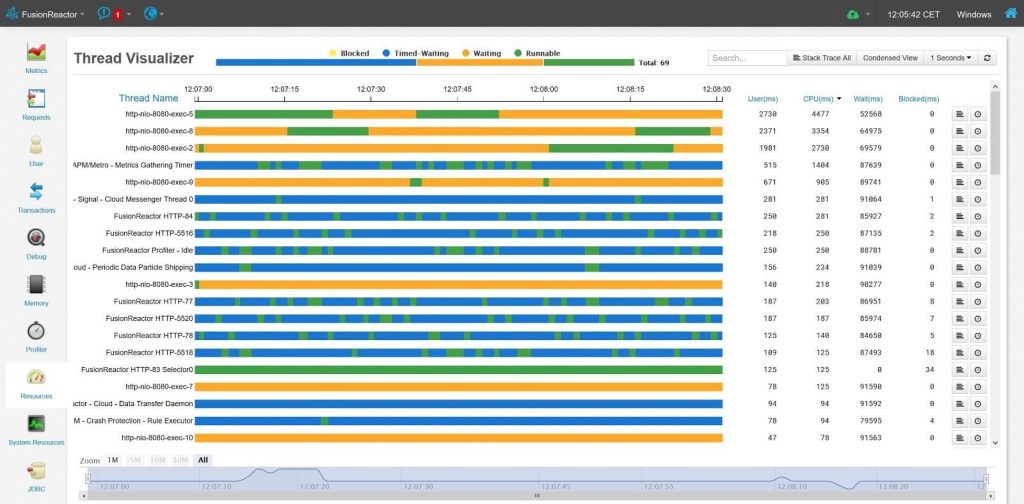
Fig 2. Continuous Profiler – Thread profiling Interface.
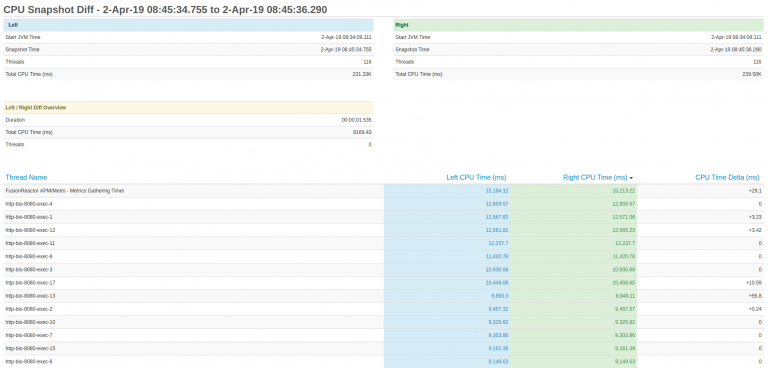
Another notable feature of continuous profiling is its ability to profile code and spot performance bottlenecks on the go. Continuous profilers come equipped with a low overhead performance analysis feature, which is perfect for your production environment. Configured to take snapshots at regular intervals, continuous profiling provides excellent real-time insight so you will never miss an issue. Since profiling involves the process of measuring what part of your application is consuming a particular resource, a continuous profiler is able to track not just memory but also CPU usage on individual threads. As well as find and tune inefficient processes running on your application server.
Fig 3. Continuous Profiler – CPU Snapshots.
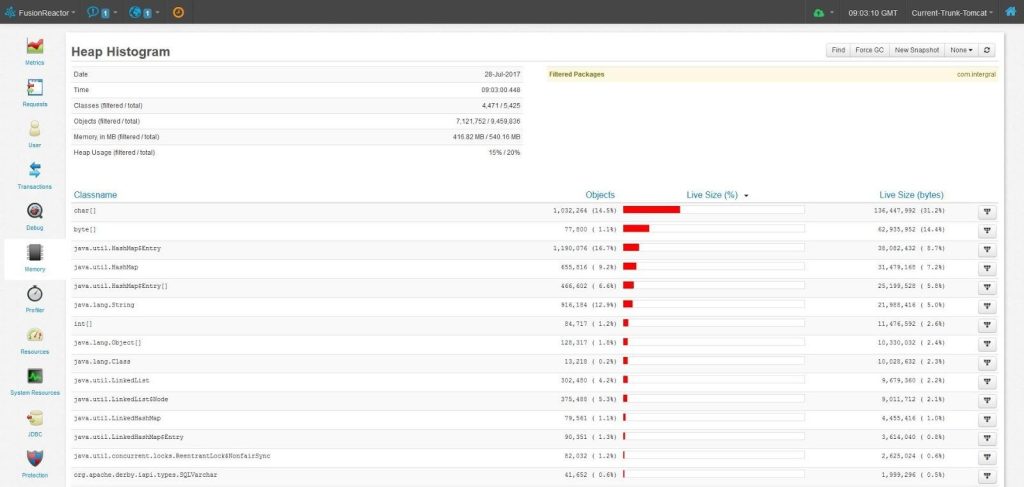
The heap memory is the runtime data area where the Java Virtual Machine (JVM) allocates memory for all class instances, methods and arrays. A continuous profiler such as FusionReactor, utilizes a graph to display such metadata as; how much heap has been used and how much is freed as the garbage collector is running. Continuous profiling also enables you to look at the heap in close detail by comparing heap snapshots from the memory view heap screen. While the stack-trace mechanism (mainly for debugging purpose) can be triggered to expose the various classes and methods for de-compilation.
Fig 4. Continuous Profiler – Heap Histogram.
Although profiling in a development environment is easy, it is hardly enough. More so, to say that pinpointing performance issues in a production environment is easy is far from true. Hence selecting the best tool for continuous profiling becomes really necessary. However, it is pertinent to consider the following conditions when choosing one, such as; That said, the aforementioned tasks would normally require the intuition of an expert. Nonetheless, with such sampling profilers like FusionReactor, there would be no need for a specialized software analyst during production-level profiling. Would you like to know more about the FusionReactor profiler? Click here to start a free trial or book a demo.
Reduce Server cost and Find Bottlenecks
Determine performance issues in a particular method.
What is the best tool for profiling?
Memory affects everything; therefore, it is critical to be able to pinpoint memory issues throughout an application development life cycle. One of the most useful functionalities of continuous profiling is that it can show us how much memory was allocated for a specific transaction or web request. With continuous profiling, you can actively track memory and subsequently optimize memory usage. This allows developers to get an instant insight into the heap in their production java applications with low overhead memory. Also, having a wider overview of how specific threads are running is essential to understanding performance syntax. A continuous profiler provides an interface where users can instrument individual threads in order to get to the root cause of the stability of performance-related issues.
Fig 2. Continuous Profiler – Thread profiling Interface.
Reduce Server cost and Find Bottlenecks
Another notable feature of continuous profiling is its ability to profile code and spot performance bottlenecks on the go. Continuous profilers come equipped with a low overhead performance analysis feature, which is perfect for your production environment. Configured to take snapshots at regular intervals, continuous profiling provides excellent real-time insight so you will never miss an issue. Since profiling involves the process of measuring what part of your application is consuming a particular resource, a continuous profiler is able to track not just memory but also CPU usage on individual threads. As well as find and tune inefficient processes running on your application server.
Fig 3. Continuous Profiler – CPU Snapshots.
Determine performance issues in a particular method.
The heap memory is the runtime data area where the Java Virtual Machine (JVM) allocates memory for all class instances, methods and arrays. A continuous profiler such as FusionReactor, utilizes a graph to display such metadata as; how much heap has been used and how much is freed as the garbage collector is running. Continuous profiling also enables you to look at the heap in close detail by comparing heap snapshots from the memory view heap screen. While the stack-trace mechanism (mainly for debugging purpose) can be triggered to expose the various classes and methods for de-compilation.
Fig 4. Continuous Profiler – Heap Histogram.
What is the best tool for profiling?
Although profiling in a development environment is easy, it is hardly enough. More so, to say that pinpointing performance issues in a production environment is easy is far from true. Hence selecting the best tool for continuous profiling becomes really necessary. However, it is pertinent to consider the following conditions when choosing one, such as;
- Choosing the right sampler for your programming language (e.g Java) with the least overhead and an optimal runtime.
- Selecting the perfect database for storing the data from your profilers.
- having a seamless means to generate reports from this data
That said, the aforementioned tasks would normally require the intuition of an expert. Nonetheless, with such sampling profilers like FusionReactor, there would be no need for a specialized software analyst during production-level profiling.
Would you like to know more about the FusionReactor profiler? Click here to start a free trial or book a demo.
There are a number of other approaches to profiling. However, if you are in a production environment, a low overhead sampling profiler seems to be a better choice. And given that continuous profiling is an approach that identifies and improves the faulty portion of your code on the fly, makes it the best option.
Why Continuous Profiling?
Because ‘continuous profiling’ is the collection of line-level profiling performance data from a production environment and making such data available to developers and operations team for rapid analysis. However, this is in contrast to an Ad Hoc production profiling – which involves the connection of a profiler to a production environment on an intermittent on-demand basis. Continuous profiling is a mechanism with significantly low overhead, that allows its user unlimited access (in real-time) to insights into code performance issues during development, staging and in production environments.
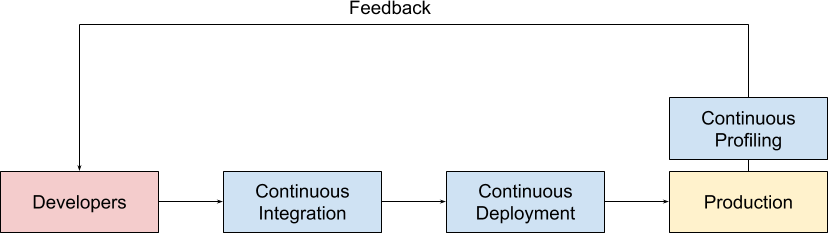
Fig 1. Continuous Profiling in a Software Development Life Cycle (SDLC).
Notably, debugging and profiling are two essential phases in software development. And as such, these stages could impact a severe strain on developers, software analysts, and the entire team if not well implemented. More so, with a Continuous Profiling system in place, developers can get a line-level understanding of the performance of their code – including but not limited to the consumption rate of such resources as CPU time, wall-clock time, memory and disk I/O which are naturally in short supply. Because these resources could lead to thread deadlocks and/or application bottlenecking when not evenly allocated.
Therefore, we need continuous profiling for the following reasons;
Evaluate overall application performance.
Memory affects everything; therefore, it is critical to be able to pinpoint memory issues throughout an application development life cycle. One of the most useful functionalities of continuous profiling is that it can show us how much memory was allocated for a specific transaction or web request. With continuous profiling, you can actively track memory and subsequently optimize memory usage. This allows developers to get an instant insight into the heap in their production java applications with low overhead memory. Also, having a wider overview of how specific threads are running is essential to understanding performance syntax. A continuous profiler provides an interface where users can instrument individual threads in order to get to the root cause of the stability of performance-related issues.
Fig 2. Continuous Profiler – Thread profiling Interface.
Reduce Server cost and Find Bottlenecks
Another notable feature of continuous profiling is its ability to profile code and spot performance bottlenecks on the go. Continuous profilers come equipped with a low overhead performance analysis feature, which is perfect for your production environment. Configured to take snapshots at regular intervals, continuous profiling provides excellent real-time insight so you will never miss an issue. Since profiling involves the process of measuring what part of your application is consuming a particular resource, a continuous profiler is able to track not just memory but also CPU usage on individual threads. As well as find and tune inefficient processes running on your application server.
Fig 3. Continuous Profiler – CPU Snapshots.
Determine performance issues in a particular method.
The heap memory is the runtime data area where the Java Virtual Machine (JVM) allocates memory for all class instances, methods and arrays. A continuous profiler such as FusionReactor, utilizes a graph to display such metadata as; how much heap has been used and how much is freed as the garbage collector is running. Continuous profiling also enables you to look at the heap in close detail by comparing heap snapshots from the memory view heap screen. While the stack-trace mechanism (mainly for debugging purpose) can be triggered to expose the various classes and methods for de-compilation.
Fig 4. Continuous Profiler – Heap Histogram.
What is the best tool for profiling?
Although profiling in a development environment is easy, it is hardly enough. More so, to say that pinpointing performance issues in a production environment is easy is far from true. Hence selecting the best tool for continuous profiling becomes really necessary. However, it is pertinent to consider the following conditions when choosing one, such as;
- Choosing the right sampler for your programming language (e.g Java) with the least overhead and an optimal runtime.
- Selecting the perfect database for storing the data from your profilers.
- having a seamless means to generate reports from this data
That said, the aforementioned tasks would normally require the intuition of an expert. Nonetheless, with such sampling profilers like FusionReactor, there would be no need for a specialized software analyst during production-level profiling.
Would you like to know more about the FusionReactor profiler? Click here to start a free trial or book a demo.
Software development in production is everything because when code fails in production, it fails in reality. Having an excellent debugging tool that debugs and profiles code efficiently is critical, and it does help you quite a lot if you want to enhance your code performance and scalability. In a development environment, the performance of a codebase could be easily optimized by means of tracing (instrumentation) profilers. Yet in a production setting, a much more different approach is employed such as a sampling profiler that entails continuous profiling. But before we delve into the importance of continuous profiling, it is necessary to stress what profiling is, in general.
Continuous Profiling in Production
Profiling is the process of monitoring various parameters such as Method Execution, Thread Execution, Object Creation and Garbage Collection. All of which helps you understand your application system and solve any issue that may arise. It is simply the analysis of your application’s performance by measuring and comparing the frequency and duration of your function calls. Hence, profiling helps you with a detailed observation of your target application execution and its resource utilization.
” In software engineering, profiling is a form of dynamic program analysis that measures, for example, the space or time complexity of a program, the usage of particular instructions, or the frequency and duration of function calls. Most commonly, profiling information serves to aid program optimization.”
Wikipedia
There are a number of other approaches to profiling. However, if you are in a production environment, a low overhead sampling profiler seems to be a better choice. And given that continuous profiling is an approach that identifies and improves the faulty portion of your code on the fly, makes it the best option.
Why Continuous Profiling?
Because ‘continuous profiling’ is the collection of line-level profiling performance data from a production environment and making such data available to developers and operations team for rapid analysis. However, this is in contrast to an Ad Hoc production profiling – which involves the connection of a profiler to a production environment on an intermittent on-demand basis. Continuous profiling is a mechanism with significantly low overhead, that allows its user unlimited access (in real-time) to insights into code performance issues during development, staging and in production environments.
Fig 1. Continuous Profiling in a Software Development Life Cycle (SDLC).
Notably, debugging and profiling are two essential phases in software development. And as such, these stages could impact a severe strain on developers, software analysts, and the entire team if not well implemented. More so, with a Continuous Profiling system in place, developers can get a line-level understanding of the performance of their code – including but not limited to the consumption rate of such resources as CPU time, wall-clock time, memory and disk I/O which are naturally in short supply. Because these resources could lead to thread deadlocks and/or application bottlenecking when not evenly allocated.
Therefore, we need continuous profiling for the following reasons;
Evaluate overall application performance.
Memory affects everything; therefore, it is critical to be able to pinpoint memory issues throughout an application development life cycle. One of the most useful functionalities of continuous profiling is that it can show us how much memory was allocated for a specific transaction or web request. With continuous profiling, you can actively track memory and subsequently optimize memory usage. This allows developers to get an instant insight into the heap in their production java applications with low overhead memory. Also, having a wider overview of how specific threads are running is essential to understanding performance syntax. A continuous profiler provides an interface where users can instrument individual threads in order to get to the root cause of the stability of performance-related issues.
Fig 2. Continuous Profiler – Thread profiling Interface.
Reduce Server cost and Find Bottlenecks
Another notable feature of continuous profiling is its ability to profile code and spot performance bottlenecks on the go. Continuous profilers come equipped with a low overhead performance analysis feature, which is perfect for your production environment. Configured to take snapshots at regular intervals, continuous profiling provides excellent real-time insight so you will never miss an issue. Since profiling involves the process of measuring what part of your application is consuming a particular resource, a continuous profiler is able to track not just memory but also CPU usage on individual threads. As well as find and tune inefficient processes running on your application server.
Fig 3. Continuous Profiler – CPU Snapshots.
Determine performance issues in a particular method.
The heap memory is the runtime data area where the Java Virtual Machine (JVM) allocates memory for all class instances, methods and arrays. A continuous profiler such as FusionReactor, utilizes a graph to display such metadata as; how much heap has been used and how much is freed as the garbage collector is running. Continuous profiling also enables you to look at the heap in close detail by comparing heap snapshots from the memory view heap screen. While the stack-trace mechanism (mainly for debugging purpose) can be triggered to expose the various classes and methods for de-compilation.
Fig 4. Continuous Profiler – Heap Histogram.
What is the best tool for profiling?
Although profiling in a development environment is easy, it is hardly enough. More so, to say that pinpointing performance issues in a production environment is easy is far from true. Hence selecting the best tool for continuous profiling becomes really necessary. However, it is pertinent to consider the following conditions when choosing one, such as;
- Choosing the right sampler for your programming language (e.g Java) with the least overhead and an optimal runtime.
- Selecting the perfect database for storing the data from your profilers.
- having a seamless means to generate reports from this data
That said, the aforementioned tasks would normally require the intuition of an expert. Nonetheless, with such sampling profilers like FusionReactor, there would be no need for a specialized software analyst during production-level profiling.
Would you like to know more about the FusionReactor profiler? Click here to start a free trial or book a demo.


