
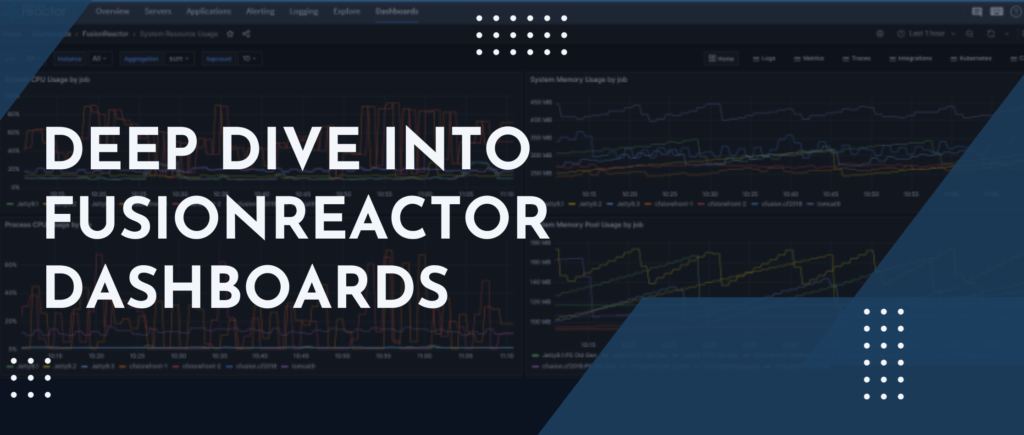
What are FusionReactor dashboards?
FusionReactor Dashboards are interactive visual representations of key metrics and data related to your application’s performance. They display real-time data in an easy-to-understand format, empowering you to make informed decisions about the health and performance of your applications. With the latest update, FusionReactor introduces a powerful new feature—Custom dashboards—that lets you create personalized dashboards. In addition, FusionReactor’s Explore feature gives you the power to query and analyze all metrics, logs, and traces ingested into your cloud account.
Benefits
Improved performance monitoring
FusionReactor dashboards provide real-time data and metrics that help you monitor the performance of your applications, identifying potential issues before they escalate.
Increased efficiency
Displaying data in a clear, concise manner enables you to grasp the health and performance of your applications quickly, reducing the time needed to gather information.
Infinitely customizable
FusionReactor dashboards can be tailored to meet the specific needs of your applications, showing only the most relevant data.
Long-term metrics review
The time picker and metrics on FusionReactor dashboards allow you to go back as far as 13 months. This extended view is invaluable for year-over-year comparisons and long-term trend analysis.
Custom dashboards
Introducing Custom dashboards
In our latest update, we are excited to introduce the feature of Custom Dashboards. This tool allows you to create your own personalized dashboards, giving you a tailored view of your application’s performance metrics.
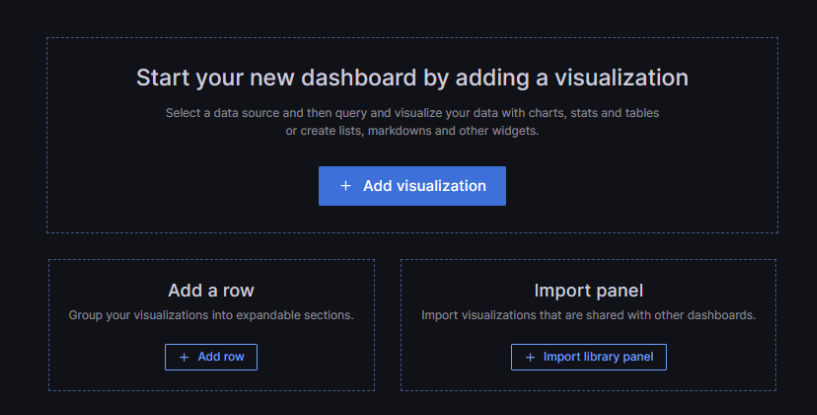
Why use Custom dashboards?
- Personalized monitoring: Now, you can monitor the metrics that matter the most to you, all in one place.
- Fully customizable: This feature enables you to add, remove, and rearrange metrics according to your specific needs.
- Streamlined experience: Custom dashboards aim to enhance user experience by providing a more efficient way to monitor applications.
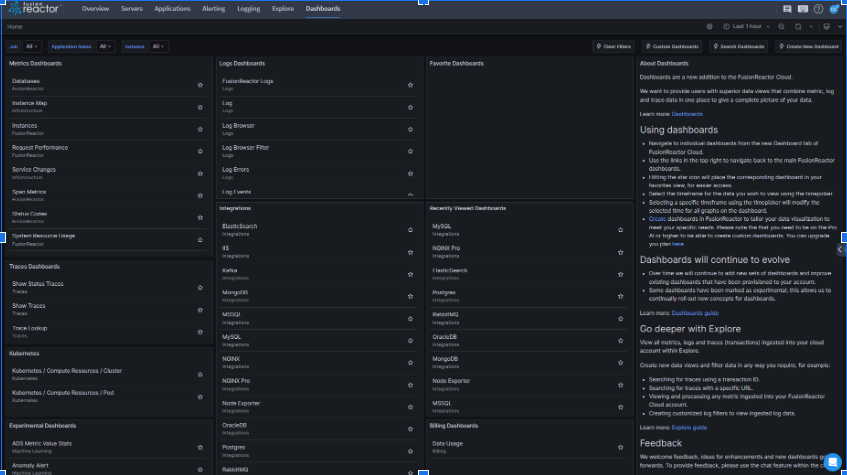
Types of FusionReactor Dashboards
Integration dashboards
Observe metrics to monitor the health of your entire infrastructure.
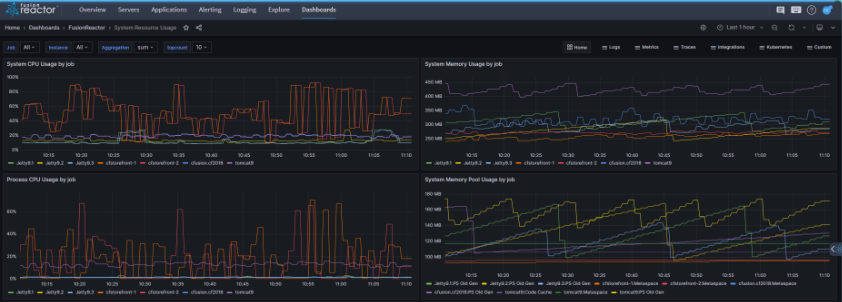
System dashboards
Get an overview of your entire system’s performance.
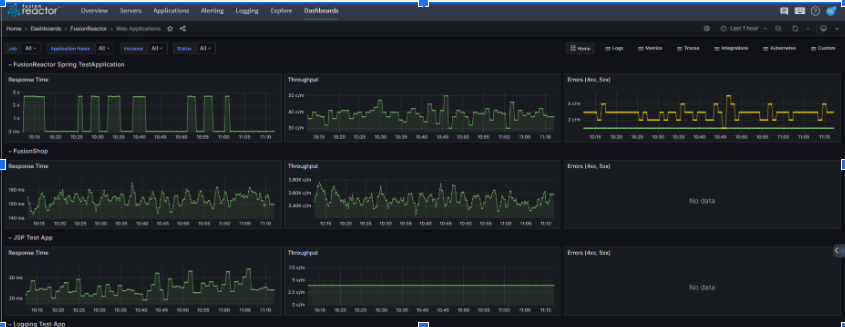
Application dashboards
These are focused on the performance of individual applications.
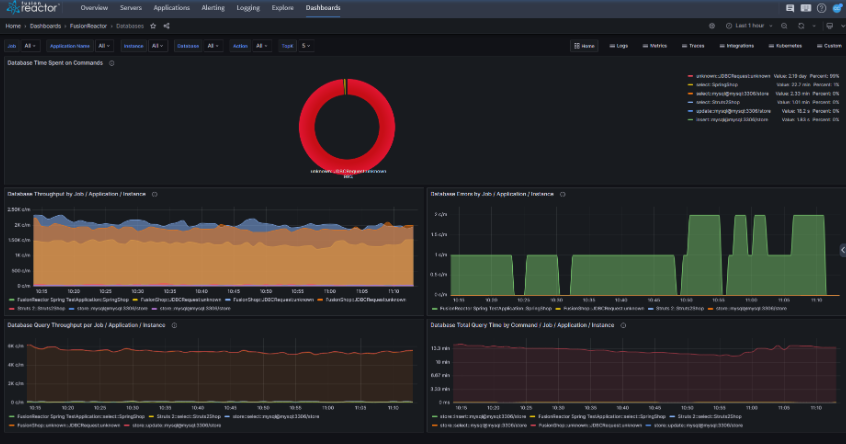
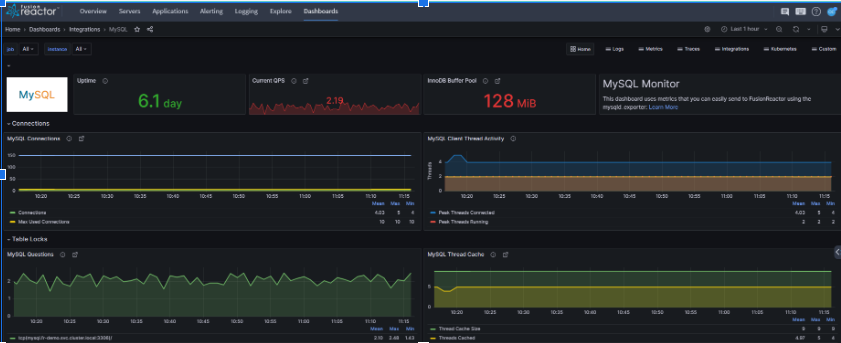
Database dashboards
Designed to offer a detailed performance analysis of your databases.
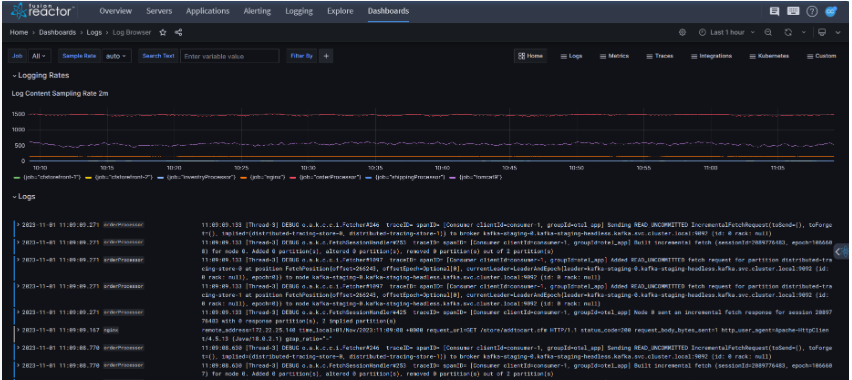
Logging dashboards
These provide pre-configured, powerful views for analyzing your log data.
Introducing Explore
What is Explore?
Explore is a feature that allows you to query and analyze all metrics, logs, and traces ingested into your FusionReactor Cloud account. It provides a versatile platform to create new data views and filter data in any way you require.
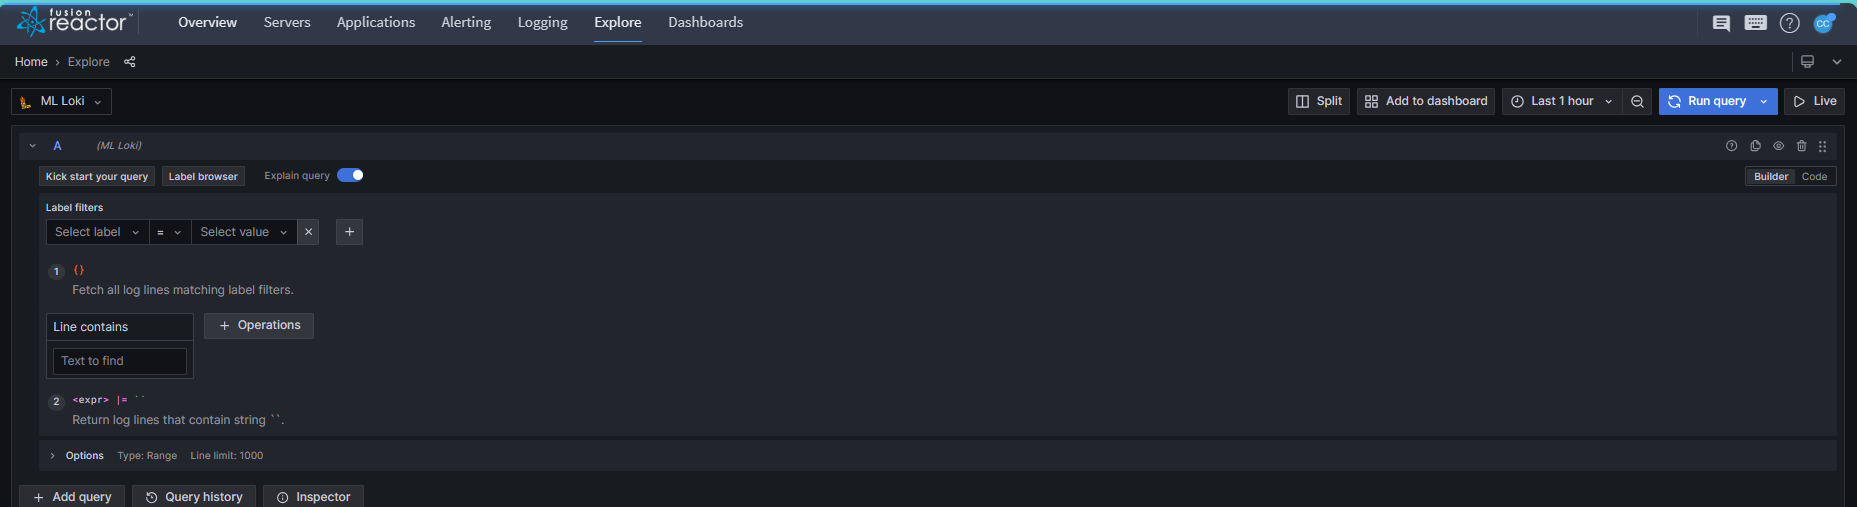
How to use Explore
- Query data: Input specific queries to sift through metrics, logs, and traces to find the data you need.
- Analyze: The Explore feature allows you to perform a deep-dive analysis. Cross-reference logs with metrics and traces to get a comprehensive understanding of your application’s performance.
- Create custom views: Use Explore to create customized data views that cater specifically to your needs, making it easier for you to monitor what matters most.
- Filter: Whether it’s sorting by time, event type, or any other parameter, Explore provides robust filtering options to get to the data you want.
Why use Explore?
- Custom insights: Tailor your data views to align with your specific monitoring needs.
- Advanced analysis: Combine different data types like metrics, logs, and traces for an in-depth understanding of your application’s performance.
- Ease of use: Despite its advanced capabilities, Explore is designed to be user-friendly, making it accessible for both novice and experienced users.
Conclusion
FusionReactor offers powerful dashboards, a Custom Dashboards feature, and an Explore function that provide a 360-degree view of your application’s health. Whether you’re looking to utilize pre-configured dashboards, delve deep into customized data queries, or create your personalized dashboards, FusionReactor has the tools you need for effective and efficient application monitoring.