
How to create fast LogQL queries to filter terabytes of logs per second with FusionReactor
Performance matters when retrieving or analyzing data. This is why the need to create fast queries which filter terabytes of logs is critical because fast retrieval is as good as efficient queries.
When queries are optimized for better and faster performance, it saves time for the developers and database administrators.
Many query languages can scan logs and retrieve data from a database. However, when it comes to filtering logs, LogQL is the query language of choice for FusionReactor.
FusionReactor with LogQL makes it easier to create fast queries to filter terabytes of logs per second. This article will break down the key concepts and give you simple tips to create fast queries in seconds.
Types of Filter
There are three main types of filters you can use to create fast queries in FusionReactor:
- Label Matchers
- Line filters
- Label Filters
Label matches
The primary function of a filter matcher is to restrict a query scan to a particular set of label values. So workloads such as cluster, container, and namespace are defined by labels, making it easy to slice and partition the data on multiple dimensions.
For instance, workloads can be defined as;
- Application within all clusters
- Application within the dev namespace within all clusters
- Production namespace
Furthermore, it’s also important to know that a label matcher can help reduce the number of logs to the amount you intend to search. We can consider this feature of Label matcher as your first line of defense when creating fast queries to filter large amounts of logs per second. Also, implementing a good label hygiene habit is very important when using FusionReactor.
Also, to avoid pulling the entire index data into your query list, you will need at least one equality matcher {cluster=”us-central1″}. For instances with more than one literals like {container=~”promtail|agent”} you can use a single regex matcher to complete the task with FusionReactor.
Let’s look at some good and bad instance of label matchers:
Bad Instance
{job=~”.*/queue”}
{namespace!~”dev-.*”}
Good:
{cluster=”us-central1″}
{container=”istio”}
{cluster=”us-central1″, container=~”agent|promtail”}
Line filters
When creating super-fast queries to filter terabytes of logs per second, Line filters are ready for the job. They can be considered the second line of defense but not entirely necessary. Whether your log contains (|=) or (!=) strings, the line filter gets the job done, and you can also use RE2 regexes to match (|~) or not match (!~) a pattern.
The order of things matters when using line filters. This allows you to chain several filters in an order that filters fast easily. So the ones that filter the most appear at the front and then apply regexes to filter those slower. It’s essential to consider the equality and inequality of some lines as they are likely to slow down regexes. However, it is customary to run equality and inequality on many lines.
As usual, some lines prove to be exceptions. FusionReactor can’t optimize lines like ~ “error|fatal” will execute no regexes.
Once you know what you are looking for, a good way to kick off is by adding a filter that aligns with your search. For example, |= “err”. Once you have executed that, you can include inequalities to stake-off undesired lines, until you have something like|= “err” != “timeout” != “cancelled” |~ “failed.*” != “memcached”.
A good way to go is to start by adding a filter that matches what you’re looking for, for instance, Execute that, then add more and more inequalities to remove what you don’t want, until you end up with something like |= “err” != “timeout” != “cancelled” |~ “failed.*” != “memcached”
Don’t be shocked with most of your errors come from Memcached; what you can do is to move it to the front of the line != “memcached” |= “err” != “timeout” != “cancelled” |~ “failed.*”. This solves the problem by executing consecutive filters fewer times.
Another usefulness of line filters in filtering logs is that you can surf trace ID, IP, and identifiers in general. Let’s look at this query: {namespace=”prod”} |= “traceID=2e2er8923100 which is a good query. We can build on this query by adding |~ “/api/v.+/query” after the ID filter to prevent the query from being executed across every line in the production namespace.
Label filters
Label filters are usually the slowest among the three filters. It’s advisable to use label filters when all hope is lost when the other two filters, or when you are trying to create complex comparisons that require extracting and converting label values into another format.
Moreover, with parsers like | json or | logfmt, you can use label filters without extracting them. So for instance, {job=”ingress/nginx”} | status_code >= 400 and cluster=”us-central2″ works fine. In our previous post, we explained that while using parsers, the | json and | logfmt parsers are speedy, regex one is slow. Therefore, it is important when using a parser, and it is important to precede your lines with a line filter to hasten the process and save time. Let’s look at this example in our Go application with FusionReactor; we can track all logs attached to this file and line number – caller=metrics.go:83
level=info ts=2020-12-07T21:03:22.885781801Z caller=metrics.go:83 org_id=29 traceID=4078dafcbc079822 latency=slow query="{cluster=\"ops-tools1\",job=\"loki-ops/querier\"} != \"logging.go\" != \"metrics.go\" |= \"recover\"" query_type=filter range_type=range length=168h0m1s step=5m0s duration=54.82511258s status=200 throughput=8.3GB total_bytes=454GB
It’s a bit different when you want to filter slow requests. Using the file and line that logs the latency as a line filter is the best option.
{namespace="loki-ops",container="query-frontend"} |= "caller=metrics.go:83" | logfmt | throughput > 1GB and duration > 10s and org_id=29
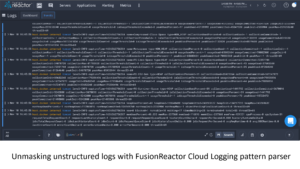
Unmasking unstructured logs with FusionReactor Cloud Logging LogQL pattern parser
Log data represents untapped or mismanaged resources for many organizations. Even if they can harness valuable insights from structured logs through their log management system, unmasking unstructured logs pose the most significant challenge.
However, with FusionReactor Cloud’s logging feature, writing LogQL queries to access and parse unstructured log formats just got easier. Parsing unstructured log data can be done a lot faster than the conventional parser. Let’s unmask more!
Use LogQL in our log monitor to Reduce issues before they affect your users
- Continuous and proactive view of performance across applications, services, and infrastructure down to the request level
- Quickly spot patterns across interconnected services, events, and issues
- Analyze logs to diagnose crashes and instability