
In order to gain additional insight into your product and the metrics it produces, you can use the Grafana Agent to ingest data into FusionReactor Cloud. This is a simple procedure that takes only a few minutes and can help you quickly investigate and pinpoint issues. In this blog post, we’ll walk you through setting up the Grafana Agent to monitor a MySQL server, using a Docker environment as an example.
What integrations are available with the Grafana Agent?
The Grafana Agent has a wide range of integrations available, including Node Exporter, MSSQL, NGINX, and others. In the future, FusionReactor will be adding additional integrations, such as Kafka, Postgres, Kubernetes, Docker, and more. These integrations allow you to ingest metrics to monitor the health of your infrastructure with metrics from all aspects of your application stack.
Configuring Grafana Agent to monitor MySQL server
To monitor a MySQL server using the Grafana Agent, you’ll need to enable the Node Xxporter to monitor the machine running your database, as well as the MySQL exporter to monitor the database itself. You can find the files for the Grafana Agent on GitHub.
This example uses two Docker containers: one for the Grafana agent, and the other for the MySQL database.
Instantly identify performance and stability problems
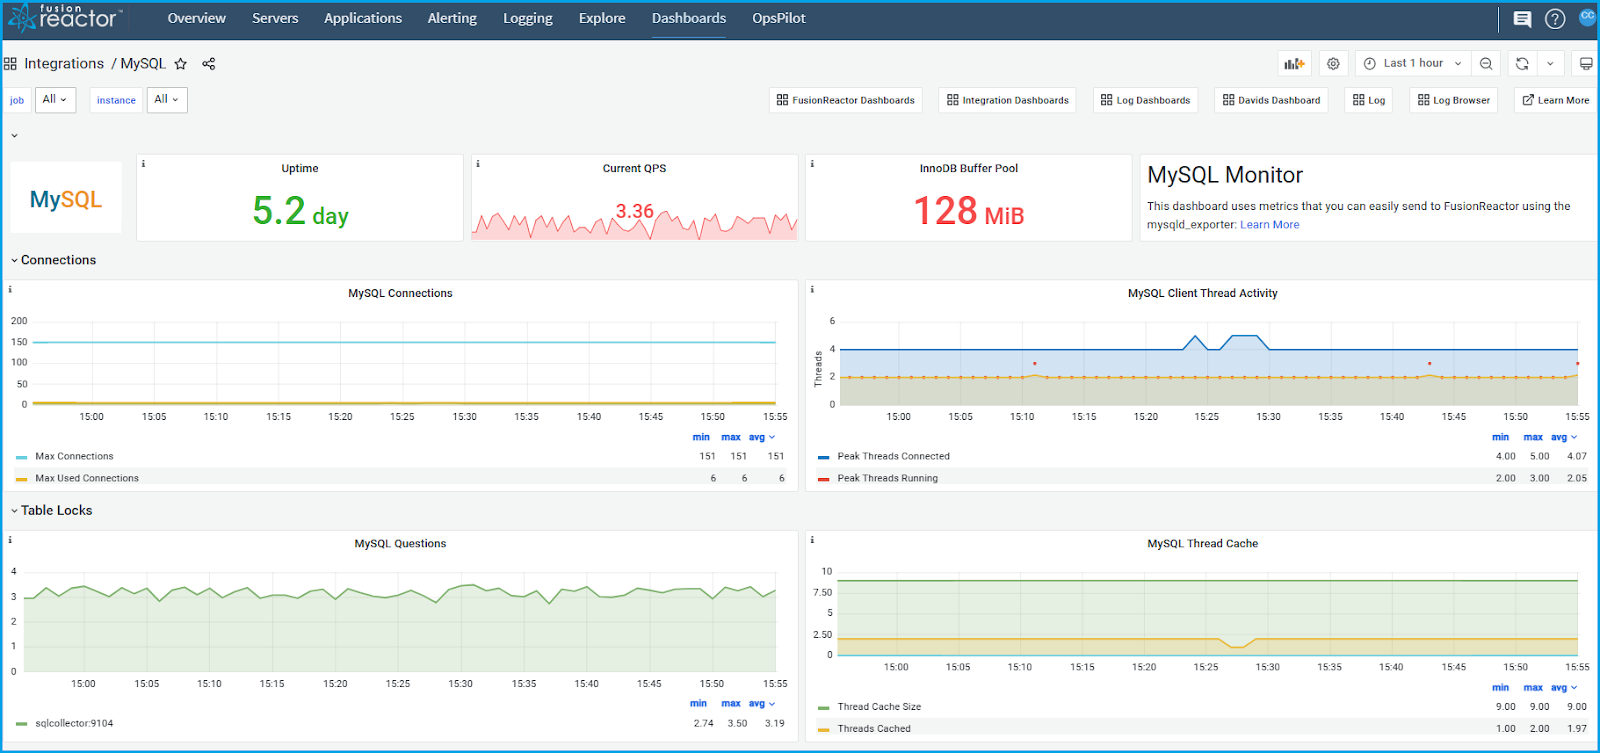
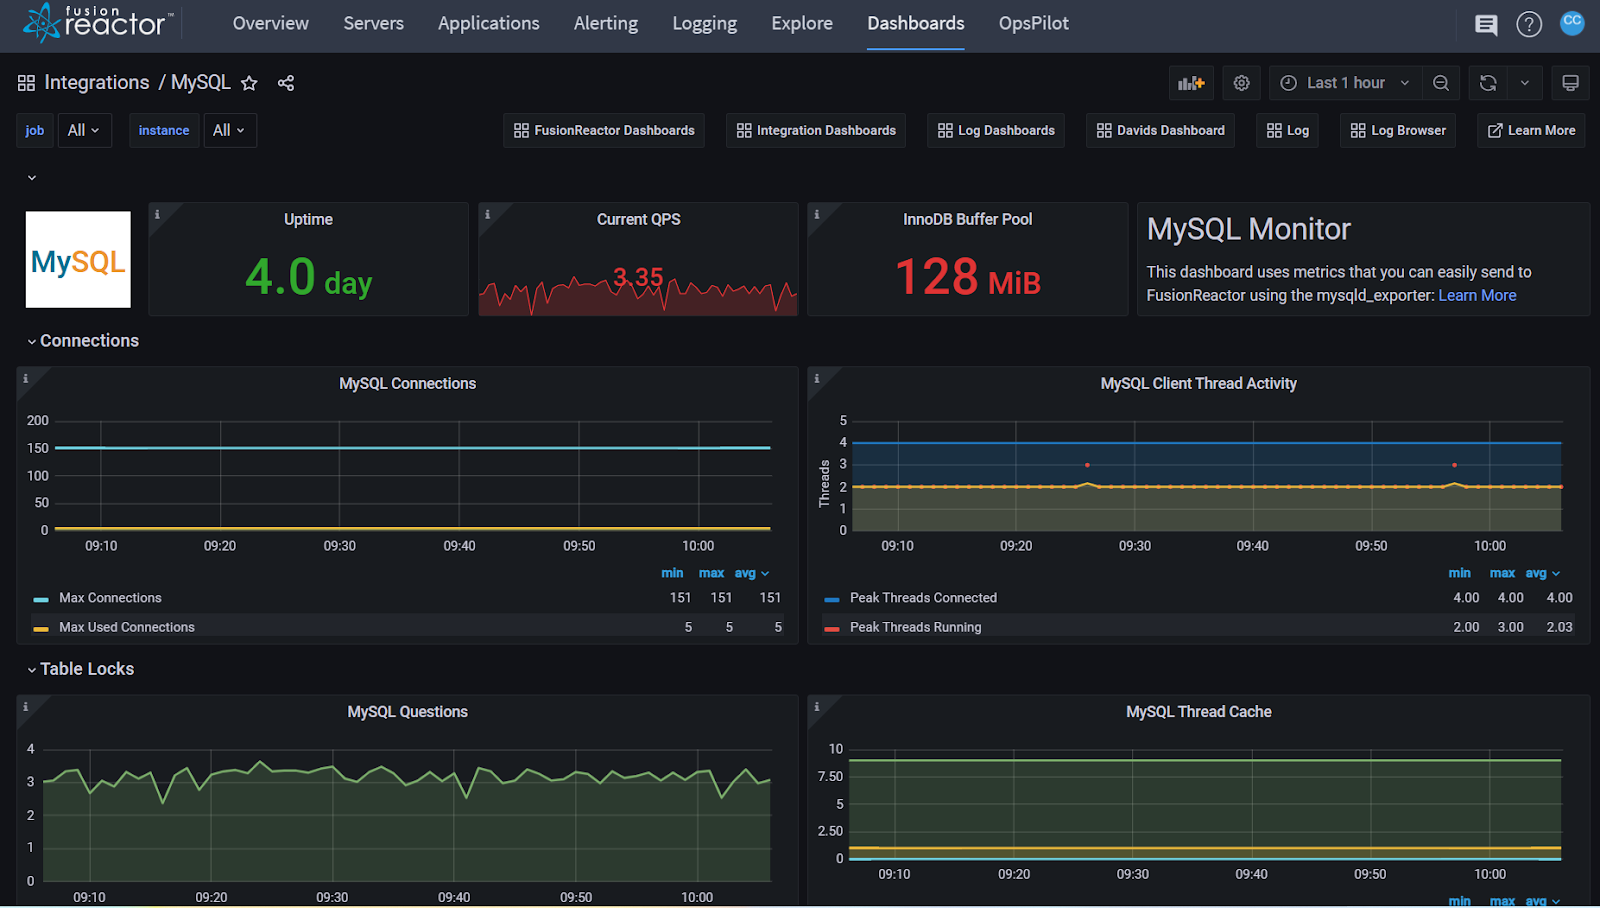
Configuring the Grafana Agent is a simple procedure that gives additional insight into your product and the metrics it produces, so you can quickly investigate and pinpoint issues. Scraped metrics are available in both Explore and the Integrations Dashboards within the FusionReactor Cloud. Integration-provided dashboards exhibit an organized set of panels designed to give you a slick, useful experience.
Step-by-step instructions
The Grafana Agent is a powerful tool to pull metrics from your servers, and this is just one example of the many implementations to use Grafana with FusionReactor.
Step 1
Navigate to the directory containing your agent.yaml configuration file.
Step 2
Open the file in a text editor and add the following section to this file, from Metric-Integrations:
metrics:
global:
scrape_interval: 1m
remote_write:
- url: "https://api.fusionreactor.io/v1/metrics"
authorization:
credentials: 7f5e1598e67524aacf90da7d8479a16f1236fe01095b081f0b684eae7570e54c4c5660b2b8adae573f860c2bca3b98b5ffe4237de2980e26d8951324ed4a9ee1
configs:
- name: nginx
scrape_configs:
static_configs:
- targets: ['{nginx-collector}:9113']
- name: mssql
scrape_configs:
static_configs:
- targets: ['{mssql-collector}:4000']
integrations:
node_exporter:
enabled: true
mysqld_exporter:
enabled: true
data_source_name: {user}:{pw}@({mysql-host}:3306)/
relabel_configs:
- source_labels: [__address__]
target_label: instance
replacement: server-a
💡Tip:
This code allows the agent to scrape and write metrics to FusionReactor Cloud. Copy the indentation correctly as the yaml syntax is very sensitive.
Step 3
Replace the credentials under authorization with your API key to authenticate with our ingest endpoints.
💡Tip:
To generate a new API key, go to FusionReactor Cloud > Account Settings > API Keys > Generate. Copy this key and paste it under credentials.
Step 4
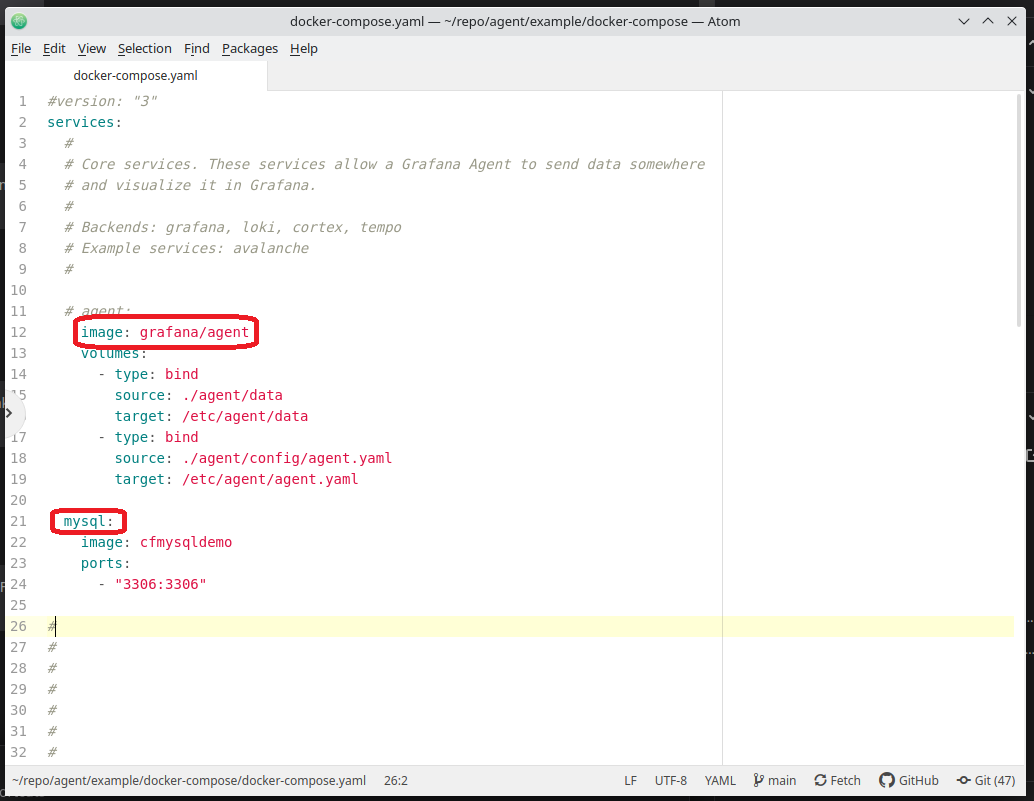
Create the Grafana Agent container and the MySQL container with the following code:
services:
agent:
image: grafana/agent
volumes:
- type: bind
source: ./agent/data
target: /etc/agent/data
- type: bind
source: ./agent/config/agent.yaml
target: /etc/agent/agent.yaml
The above example involves volume mounting the agent config file. Alternatively, add the config to your docker image.
💡Tip:
Amend the file path under source to point to the location of the agent.yaml file and rename the MySQL image to your own.
Step 5
Run “docker-compose up -d” to bring up the containers.
Step 6
Navigate to FusionReactor Cloud to access the many features available such as Dashboards, without needing any additional configuration.
Step 7
Select the MySQL Integrations Dashboard > Explore > Code to display the Metrics browser.
💡Tip:
Selecting, for example, mysql_up query > use query > run query will show the agent is now receiving data from the Grafana agent.