
The ColdFusion Metrics and System Metrics have similar features but differ by their distinct graphical illustration pages displaying such information as processed requests and management internal requests. ColdFusion Metrics and System Metrics are slated for a specific version of the ColdFusion series – ColdFusion Standard AND Enterprise 8, 9, 10, 11, 16, CF 2018, and CF 2021. The bulk of the information displayed is retrieved from the ColdFusion native profiler.
In order to see metrics from CF2021 in FusionReactor, you first need to install the Perfmon module in ColdFusion.
Whilst ColdFusion is used to display server specific details, it is handy in determining actual & presentable data regarding the server traffic. However, unlike the ColdFusion Metric page, the ColdFusion System Metrics visualizes eight different graphs, as listed below: Scopes, Query Cache, Template Cache, Template Cache Hit Ratio, CF Threads, Throttled Memory, Throttled Queue Size, Concurrent User Count.
ColdFusion Metrics Page
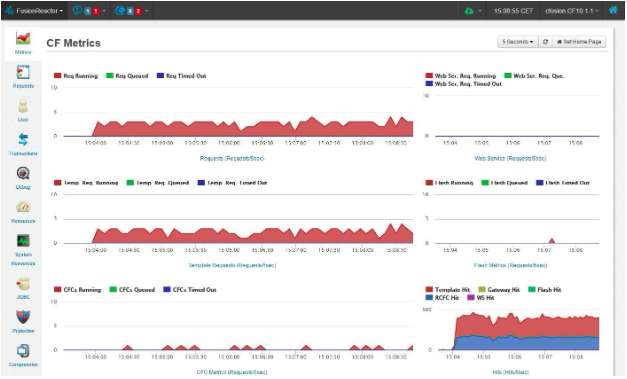
The graph system in the ColdFusion Metric pages is subdivided into six different graphs. Alternating between three other series and states – apart from the Hits Graph. These series include:
- Running State: All requests that are currently active at a particular point in time.
- Queued State: All requests are being queued for processes.
- Timed-Out State: All requests that were timed-out due to time-consuming load time.
Typically, the ColdFusion Metric pages are populated with such data as; information about requests, statistics on the various Web Service inquiries, data on template requests, Statistics on Flash requests, information on ColdFusion Components, and the cumulative number of all types of request over a given timeframe.
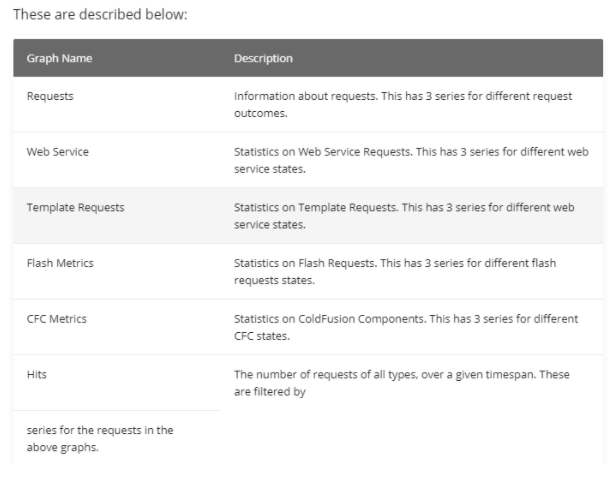
Fig. 1: Description of the types of Graphs displayed on the ColdFusion Metric Page.
The ColdFusion Metrics page enjoys a display of the Hit Count and the DB Pool Stats. This entails the visualization of how frequently the different types of requests are sent and the total of all the request types; and an overview of the state of the database pool, respectively.
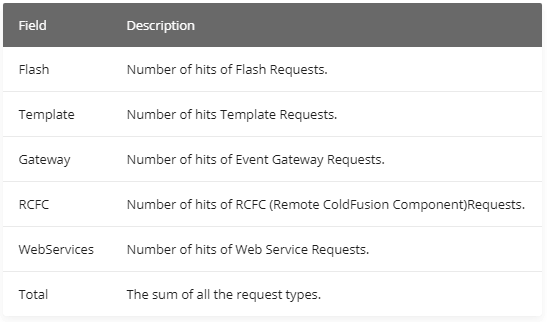
Fig. 2: Hits count table description.
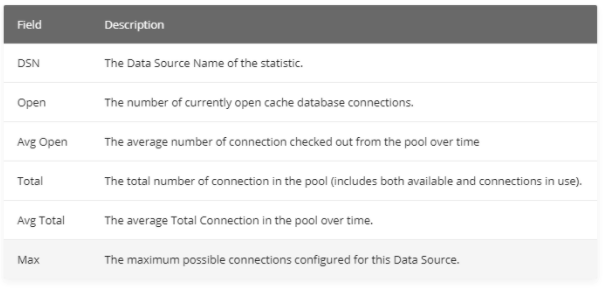
Fig. 3: The DB Pool Stats Table.
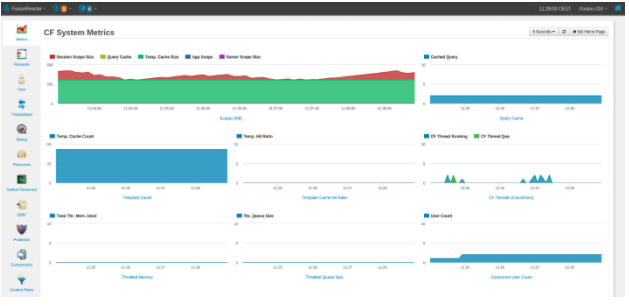
ColdFusion System Metrics Page
As earlier stated, the ColdFusion System Metric page displays eight different graph visualizations to handle internal requests, such as; outlining the extent of each area described in the graphs series and registering the number of ColdFusion queries currently cached. The number of template requests stored in the cache and requests being processed through the cache in contrast to the total amount of template requests being completed at a given point in time is also displayed on the ColdFusion System Metric page.
The ColdFusion threads chart shows the amount of CF threads that are currently in the running or queued state at any given moment. Similarly, the Graph also displays the amount of memory that is being throttled. As well as the throttle memory pool size created by the ColdFusion application. Also, the number of users on the CF 2021 network can be measured using the <cflogin> tag.
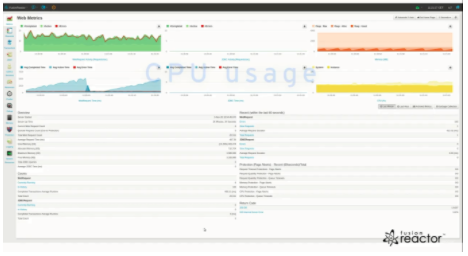
Fig 2: Get Actionable Data to Pinpoint & Fix Issues in ColdFusion.
Recommended by Adobe as the number one tool for monitoring and profiling ColdFusion CF 2021, FusionReactor does not only identify bottlenecks in your ColdFusion application. It utilizes a stack trace feature to provide detailed insight into running. It also helps learn performance issues and ColdFusion errors. With over 40 unique ColdFusion metrics display systems, FusionReactor gives you even more details in real-time like; the number of currently running sessions, hit counts, application scope, DB pool stats, active sessions, etc., than ColdFusion’s in-built profiler.
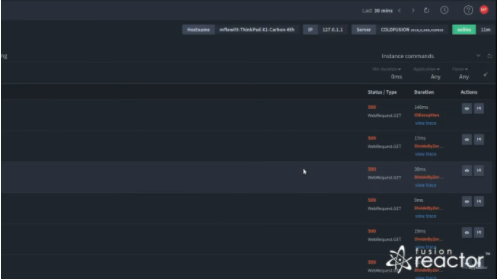
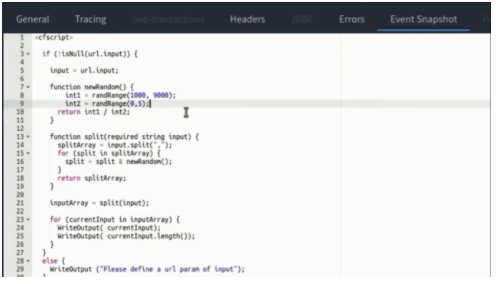
Instantly See Why Code Is Breaking
Unlocking FusionReactor’s Event snapshot functionality routinely tracks bottlenecks, bugs, and issues in your codebase by providing complete source code, variables, stack trace, and optimal environment state in the event of an error.