

A customer recently wrote into the FusionReactor Support Team regarding their ColdFusion server, which was crashing on average once per week. We have used FusionReactor and specifically the archive viewer, to take the customers archived log data and diagnose the root cause of the issue.
This blog will explain the process of how it is possible to diagnose the root cause of the crash with the Archive viewer, a feature introduced in FusionReactor 7.2.0 that allows users to display and graph historical log data in a similar fashion to viewing data in the “live or recent” monitored application server.
Starting by viewing the resource log it was possible to see that the total memory allocated by the JVM was exceeding the maximum memory configured in the ColdFusion server:
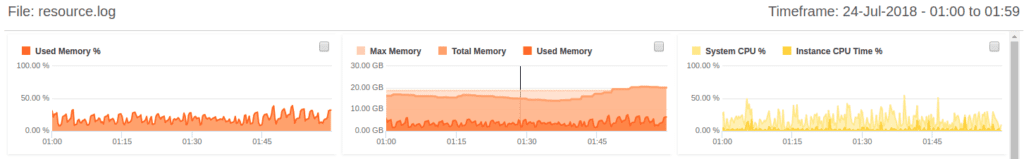
Resource.log
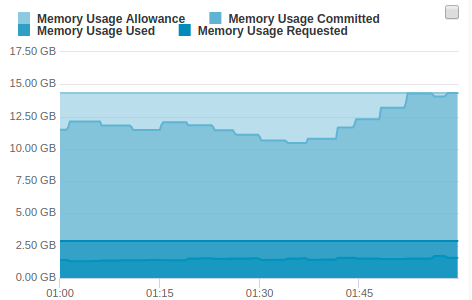
From there it was then obvious that there was clearly an issue with memory usage in the server, looking in the memory summary logs it was then possible to see that the actual memory usage was only 20% of the usable memory, however, the committed memory was high.
Memory Summary Usage
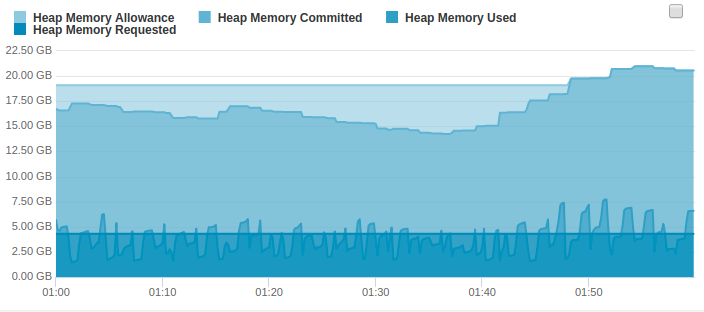
The fact that the heap usage was only 20%, yet the committed memory was high points to the fact that a particular memory space was attempting to use more memory than it had available. At this point, it was then possible to log at the logs for each available memory space. From this, it was possible to see that the old gen memory space allocated had committed 14GB of its available space:
OldGen Memory Usage
The Old Gen memory space is used for long living objects that are committed to the JVM for longer periods of time, this includes objects such as the ColdFusion scopes and classes that are loaded into memory, this space is only cleared when major garbage collections occur within the JVM.
In a typical ColdFusion server, you will see considerably more minor garbage collections than major garbage collections, however using the gc (garbage collection) logs it was possible to see that large garbage collections were occurring on average every 4 minutes and taking between 750 ms and 1.5 seconds each time:
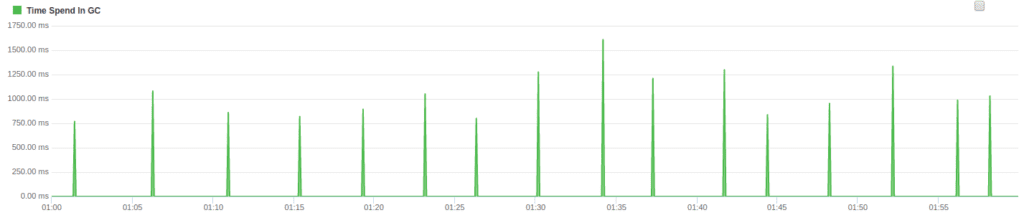
GC Marksweep times
Time spend on major garbage collections in Java will consume large amounts of CPU and reduce the performance of the application server.
Using the classes log file it was then possible to see that there was a very large number of classes loaded into the JVM, which would explain why 14GB of OldGen memory was committed to memory and the JVM was no longer able to allocate the required memory needed to run the application:
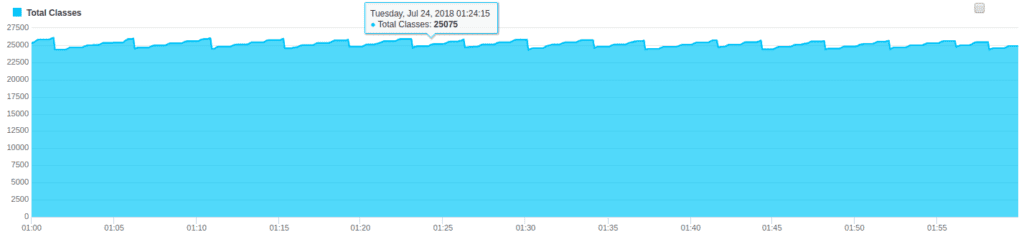
Count of loaded classes
It is important to note that the fact that the number of loaded classes is high is not the only cause of the Application server running out of OldGen Memory, but it is indeed a factor. In the Case of this ColdFusion server, the OldGen will contain the session scops, user session tracking, all loaded classes and many other objects that will need to exist for a longer period of time.
However, the fact that classes are being loaded periodically in this manner is highly irregular and would be cause for concern. If I take another CF server that is healthy I would see something similar to:
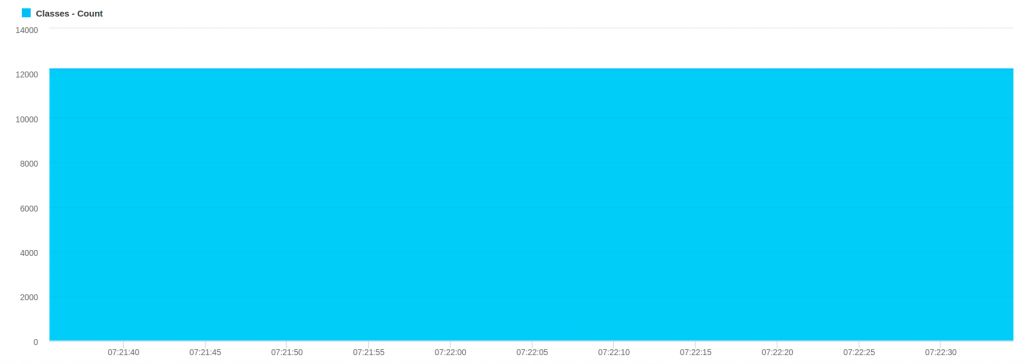
Example of the count of loaded classes for a similar ColdFusion server that is in a healthy state
From this it is possible to see that there is a much lower class count and most importantly the graph is flat, this is what I would expect as classes committed to the OldGen space should not be cleared and reloaded into memory this often, Only if Java believes the classes loaded are too old and there is a potential that the bytecode has changed.
From this information, it was then possible to recommend increasing the maximum heap space available on the JVM and potentially the available resource for OldGen memory, trimming down the running CFML applications would also be a possible solution to reduce the Old Gen and heap usage of the running JVM.