An example of OutOfMemory exception
import java.util.ArrayList;
import java.util.List;public class MemoryDemo {
public static void main(String[] args) {
List<Integer> list = new ArrayList<Integer>();
while (true) {
for (int i = 0; i < 1000000; i++) {
list.add(i);
}
System.out.println("List size: " + list.size());
try {
Thread.sleep(1000);
} catch (InterruptedException e) {
e.printStackTrace();
}
}
}
}
In this example, the MemoryDemo class creates an ArrayList and adds 1,000,000 integers to it every second. This will cause the application to consume increasingly large amounts of memory over time, eventually leading to an OutOfMemory Exception.
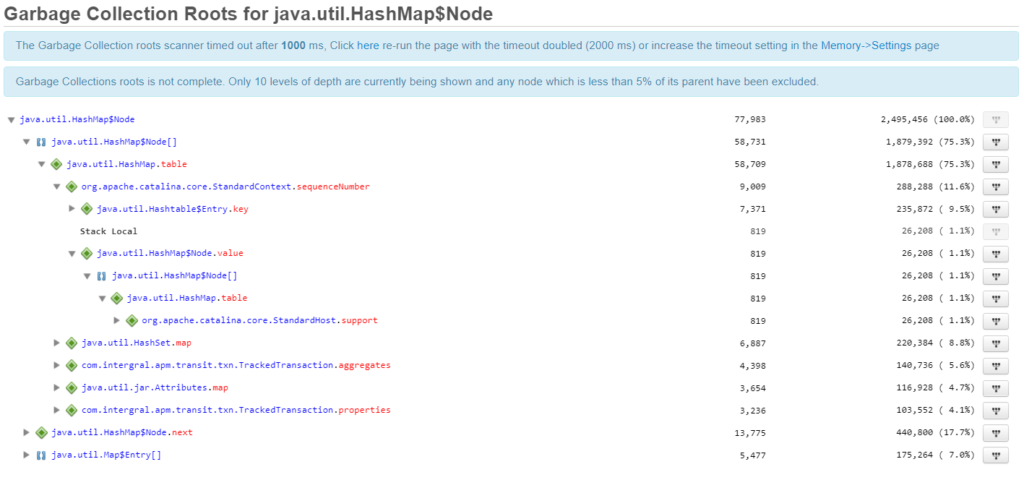
By running this code with Fusionreactor APM, organizations can use the memory profiler and allocation viewer to identify excessive memory usage and pinpoint the root cause of the issue. They can then make adjustments to the code to optimize memory usage and prevent OutOfMemory Exceptions from occurring in the future.
This is just one example of how Fusionreactor APM can troubleshoot memory-related issues in Java applications. With robust monitoring and analysis capabilities, organizations can efficiently identify and resolve memory-related problems and maintain high application performance and uptime levels in production environments.
What is an OutOfMemory exception?
OutOfMemory Exceptions and Memory Leaks are common issues that can cause application downtime and poor performance in production environments. Fortunately, there are tools available to help troubleshoot and resolve these issues, such as Fusionreactor APM. Here are some specific features of Fusionreactor APM and how they can help:
Memory profiler
A memory profiler is a powerful tool to help identify memory usage patterns and highlight potential issues. With the memory profiler, organizations can quickly identify areas of excessive memory usage and determine the root cause of memory-related problems such as OutOfMemory Exceptions and Memory Leaks.
Garbage collection viewer
The garbage collection viewer visualizes garbage collection activity, which can help organizations identify potential issues and optimize garbage collection settings. By analyzing garbage collection activity over time, organizations can identify patterns and make informed decisions about optimizing garbage collection to prevent OutOfMemory Exceptions and Memory Leaks.
Memory allocation viewer
The memory allocation viewer displays detailed information about memory allocation and usage, including the size and type of allocated memory, as well as the number of objects and threads. With this information, organizations can identify memory usage patterns and make informed decisions about how to optimize memory allocation to prevent OutOfMemory Exceptions and Memory Leaks.
Recommendations for optimizing memory usage
Fusionreactor APM provides recommendations for optimizing memory usage based on real-time monitoring and analysis of memory usage patterns. By following these recommendations, organizations can optimize memory usage and prevent OutOfMemory Exceptions and Memory Leaks from occurring.
Proactive monitoring
Fusionreactor APM provides proactive monitoring of memory usage patterns, which can help identify potential issues before they cause problems. With proactive monitoring, organizations can detect and resolve memory-related matters quickly and efficiently, minimizing the risk of application downtime and poor performance.
By using the comprehensive monitoring and analysis capabilities of Fusionreactor APM, organizations can efficiently troubleshoot memory issues and ensure their applications perform optimally in production environments.
Conclusion – How to Troubleshoot Memory Leaks in Production
Memory issues can be difficult to troubleshoot in production environments. However, with the help of tools like Fusionreactor APM, organizations can identify and resolve OutOfMemory Exceptions and Memory Leaks quickly and efficiently. By using the powerful features of Fusionreactor APM, such as the memory profiler, garbage collection viewer, memory allocation viewer, and proactive monitoring capabilities, organizations can ensure their applications perform optimally and avoid costly downtime.
In addition to memory-related issues, Fusionreactor APM provides comprehensive monitoring and analysis capabilities for other aspects of application performance, such as CPU usage, database performance, and request response times. With all these features combined, Fusionreactor APM is a powerful tool that can help organizations maintain high levels of application performance and uptime in even the most complex production environments.


