
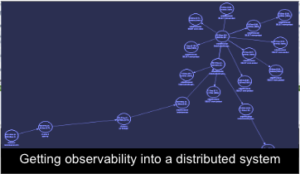
FusionReactor is evolving from APM to an observability platform, this means that we will be offering new dashboards to help you troubleshoot in a new holistic way with support for far more languages through OpenTelemetry.
To demonstrate our new dashboard capability we have built a simple e-commerce application.
We have built a store application
- Frontend with 3 replicas – Lucee
- An order processor with 2 replicas – Java using Otel instead of the native FusionReactor agent
- Shipping processor no replicas – Node
- Inventory processor – Go
- Single database and an event bus
So to summarize we have a shop app, build in a variety of languages connected to a single database and a data bus.
What do we mean by dashboards?
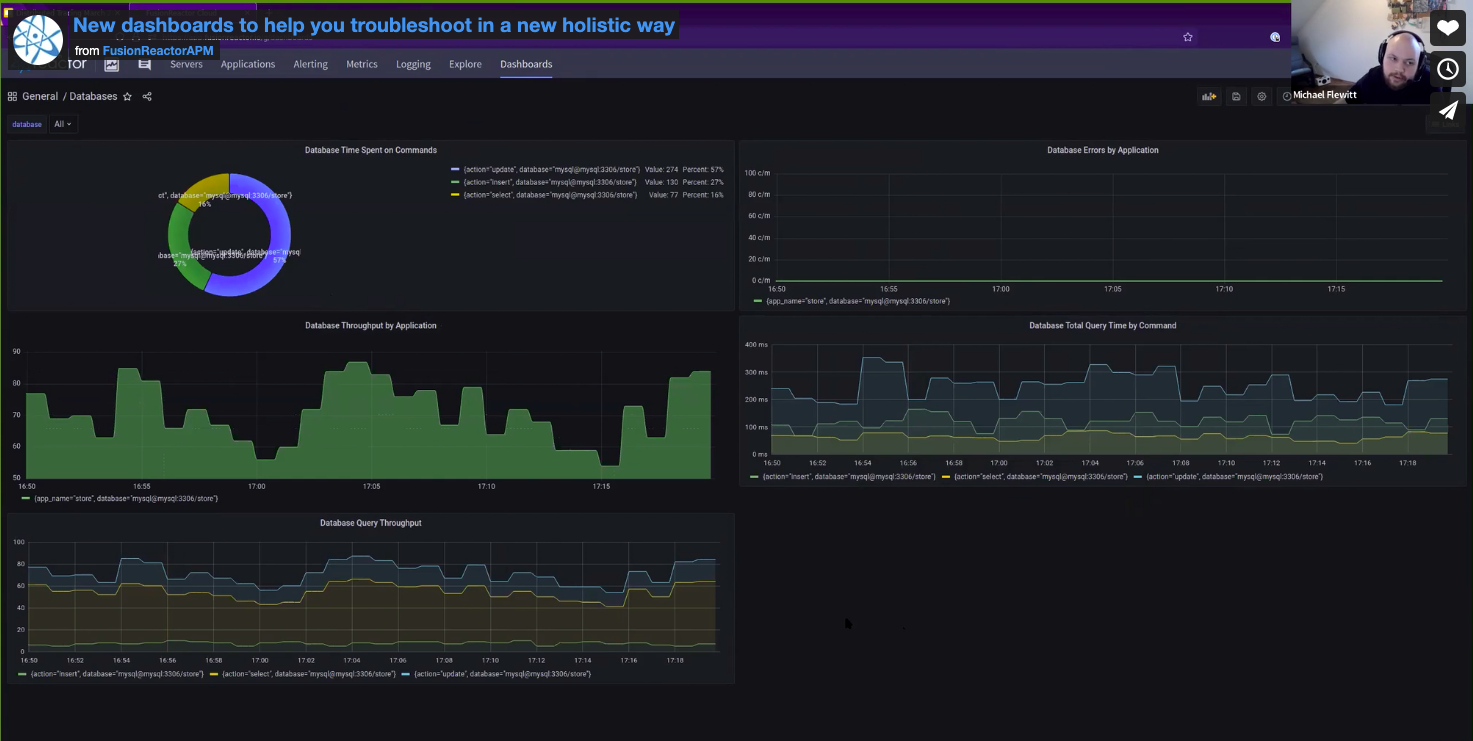
Our new dashboards help you troubleshoot your database. The database dashboard gives you a holistic view of all of your captured data and present it in a way that is easy to interpret.
Troubleshooting the database using dashboards
A database dashboard allows us to better understand how our app and services interact with the database. It allows us to examine all of our instances in one view and understand the calls for all connected databases.
- The nature of the call; is it a select, an insert or an update
- How many queries have been run
- The time it takes for them to run
- How many errors
If you want to filter down to a single instance then this can be done with a single click. If you want to look at a specific database then this can easily be done.
Monitoring your application for peace of mind
Having insight into our request performance is vital when looking at the overall performance of our application. Using our request dashboard enables us to get a good overall view of the vital KPI’s
- Throughput per page
- Request durations
- Top requests
- Errors
Of cause, you need to be able to filter down by application or even by transaction and that is very easily done. The request dashboard gives you everything you need on a daily basis to know that your application is performing as it should.

Monitoring external services
In a modern distributed world understanding what’s happening within your application is no longer enough. Lots of external services influence the overall delivery of your application, the bit that your customers see.
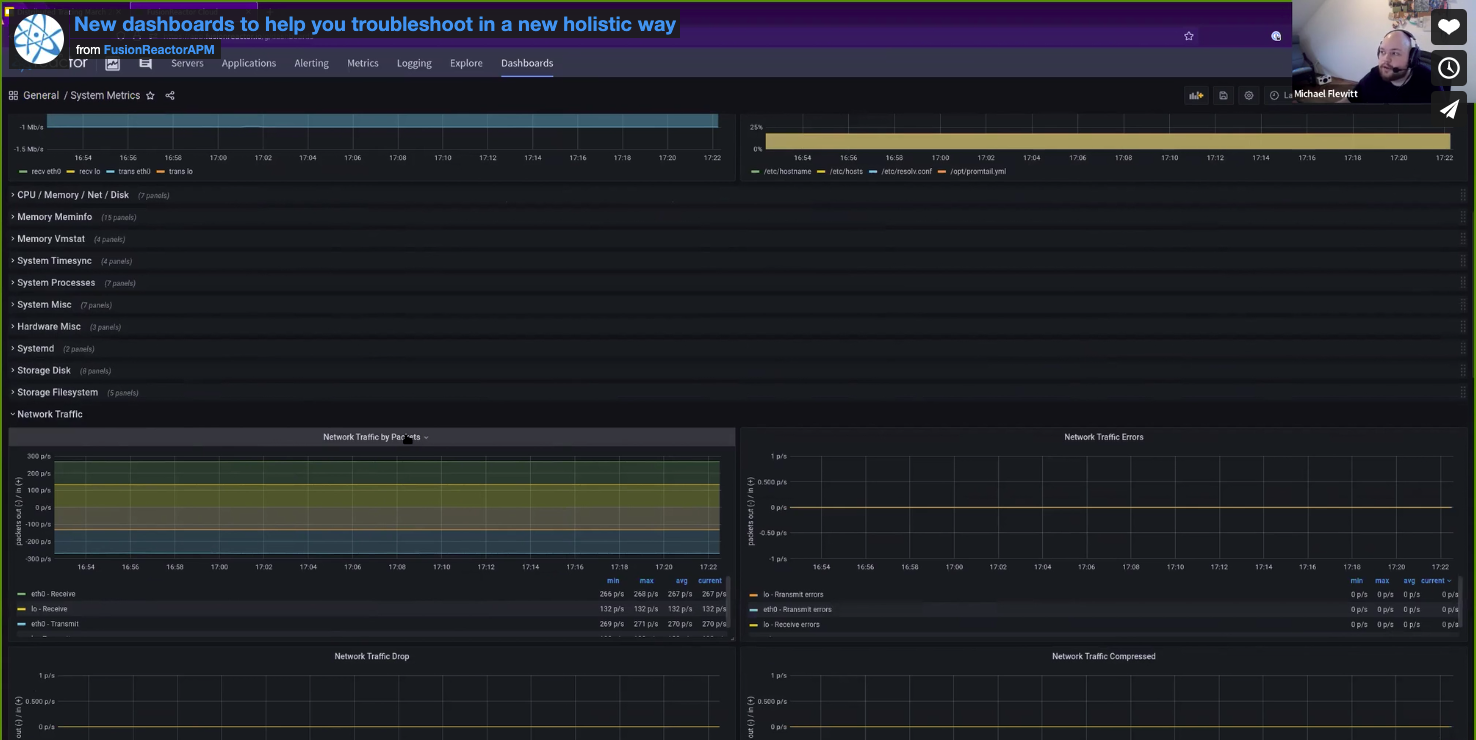
System metrics
FusionReactor allows you to ingest data from any of your external systems and services. This allows you to get a good overview of your system as a whole. You will get a holistic view of core system metrics such as CPU, memory and heap performance. IF you need to drill down then this is easy with our dashboard so you can look at things metrics and network or disk storage. If you want to look at a specific time then this can be filtered too, you can even go back in time – so if you know you had an issue at a specific time you can see the dashboard and then start exploring.
Very low overhead
So what you really don’t want is your monitor taking up valuable overhead and slowing down your system performance. In our example, we are piping in data directly from Node and Otel directly into our dashboard.
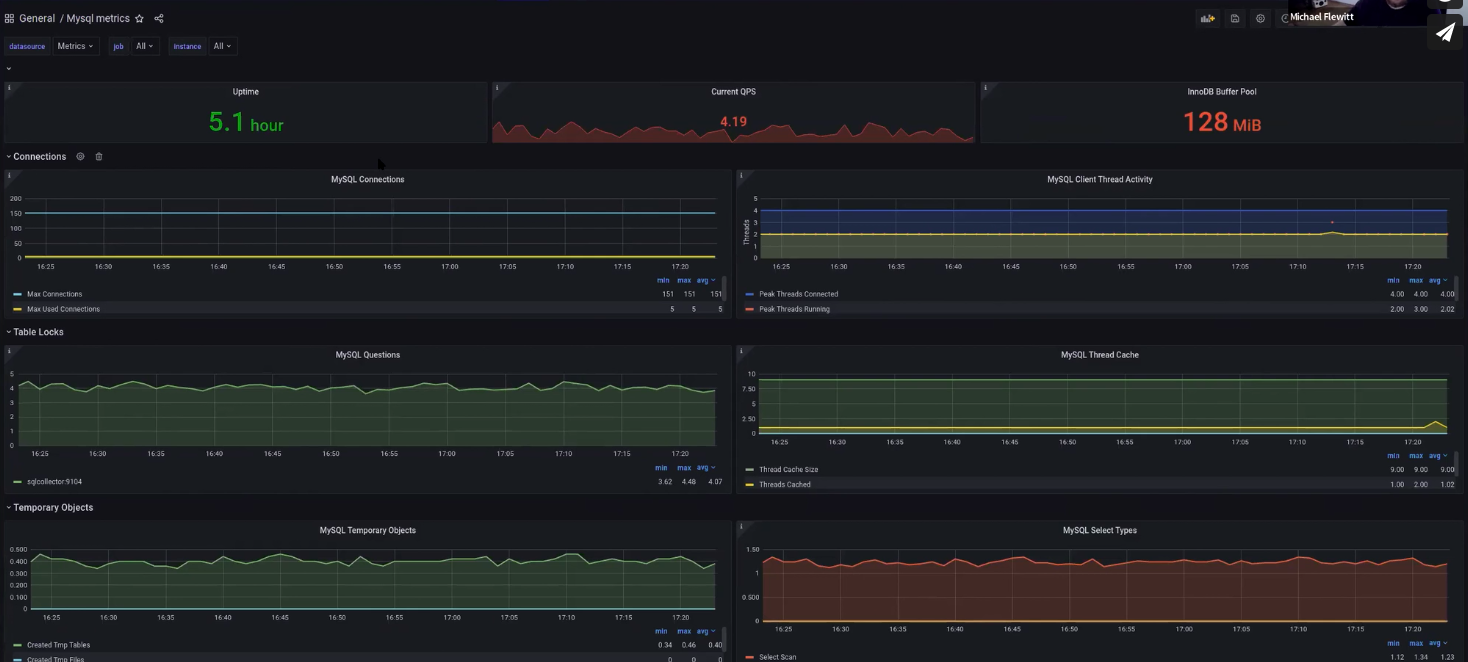
Complete database monitoring
The database monitoring dashboard doesn’t report on how the application is interacting with the database. It shows you what the database itself is doing, in my example, it is monitoring the MySQL process.
It will tell you about your uptime connections. The dashboard will show you for example, If your DB has reached max connections and consequently your app is struggling. You can see query volumes, errors, and cache information, so everything you need to fully monitor your database. You can compare connections to the database as a whole to connections to your app. So you really don’t need an external DB monitor anymore!
Log dashboard to help you troubleshoot
Now the final dashboard in our demonstration is our log dashboard. This one is a little different as it isn’t just graphs and charts, but also raw log content.
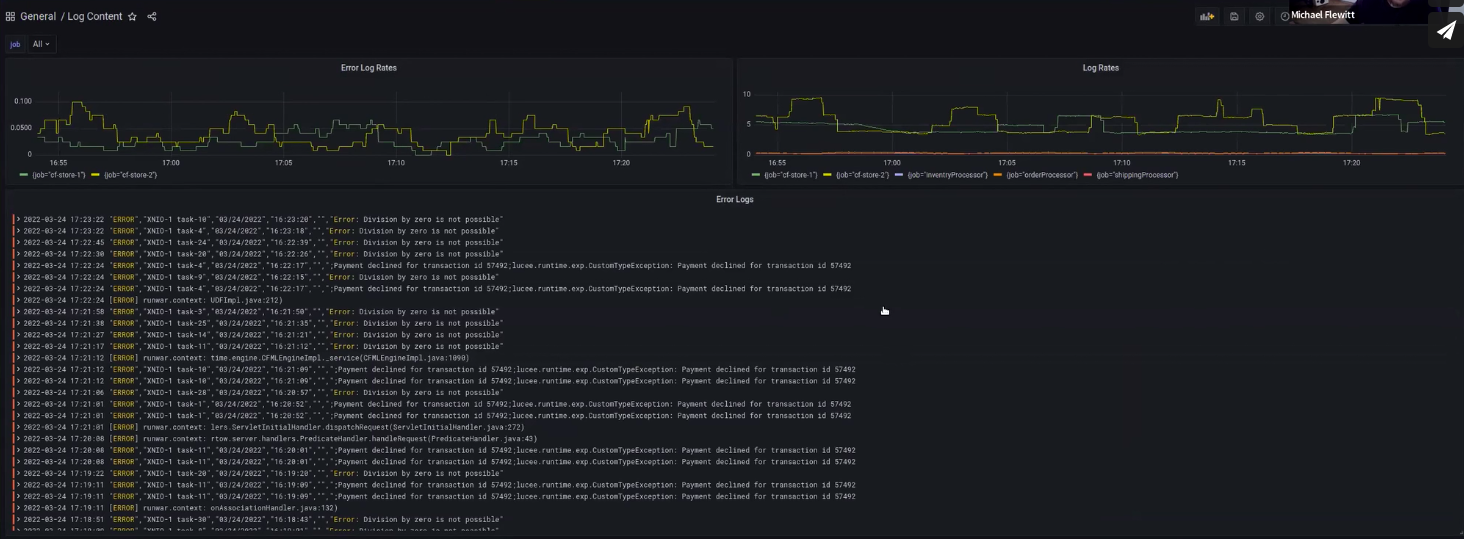
Drill down to the detail of your logs
Now the final dashboard I’m going to show is for the log content, and this is a slightly different dashboard. So for this one here, It’s actually using not just graphs, but it’s also dumping out raw log content. In this example, I’ve got a graph showing error rates in my logs, and I have a graph for overall log breaks. We can see clearly that CF stores generate the most logs.
By mousing over a part of the timeline on the graph we can zoom in on all the logs that were generated during this timeframe.

In the video, I had a few divided by zeros and I had a few payments declined exceptions. If you have an error in production or you see a spike in errors is an easy way to quickly troubleshoot the issue.
What’s coming in FusionReactor?
FusionReacgtor Cloud is evolving and giving the user lots more to enable a truly holistic view across your entire architecture.
- more data,
- more traces,
- more logs,
- more metrics
All of the dashboards you’ve talked about in this article, along with many others, we will automatically provision for you.
If you ingest data from a service then we will automatically create a relevant dashboard for you. So if you connect to a node app – you will get a node app dashboard. Same for any of the technologies that OpenTelemetry works with.
You can customize any of the automatic dashboards and make new ones yourself using our improved easy to use UI.
Improved alerting
So anyone familiar with the Cloud you’ll have seen the current Cloud alerting. You can alert basically on any FusionReactor metric and send it to Slack, email PagerDuty, VictorOps, anything like that. We are going to improve that so you can alert on any external data that you ingest into FusionReactor.
We can automatically give you these dashboards without you having to actively create them. And then you can, if you want to create your own dashboard, Customize the ones we give you to give you the view of all this data that works for you.
So in terms of what’s coming next, we have five kinds of key steps to the journey of this. And the first is to improve alerting. So anyone familiar with cloud you’ll have seen the current cloud alerting. You can alert basically on any FusionReactor metric and send it to Slack, email PagerDuty, VictorOps, anything like that.
Observability on a local basis
At the moment we are working on the Cloud observability platform, but we understand that not everyone can send data up to the cloud for a whole host of reasons. So all of these dashboards, distributed tracing and log monitoring will all be available in a local version of FusionReactor.
AI and Machine learning
AI and machine learning aren’t that far away. What it will mean to FR users is that we will start telling the nature of an issue and where it is occurring in real-time, meaning that you will no longer have to spend time performing root cause analysis.