
FusionReactor is evolving from APM to an observability platform that allows you to get observability into a distributed system. This means that we will be offering a more holistic view of distributed services with support for far more languages through OpenTelemetry.
To demonstrate our distributed tracing capability we have built a simple e-commerce application.
We have built a store application
- Frontend with 3 replicas – Lucee
- An order processor with 2 replicas – Java using Otel instead of the native FusionReactor agent
- Shipping processor with 1 replica – Node using Otel
- Inventory processor with 2 replicas – Go using Otel
- Single MySQL database and a Kafka event bus
So to summarize we have a shop app, build in a variety of languages connected to a single database and a data bus.
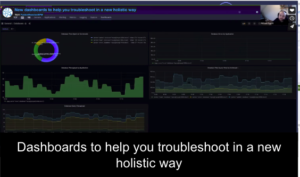
Observability from a modern distributed architecture
- Ingest external systems and combine them with your application data for a true end to end view of your application and your microservices.
- Distributed tracing – holistic view of all traces across your entire system
- Log Monitoring – combining FR logs with other logs that you capture
- Expanded metrics allow you to use metrics from your other systems with FR metrics
- Language support – 12 languages and growing
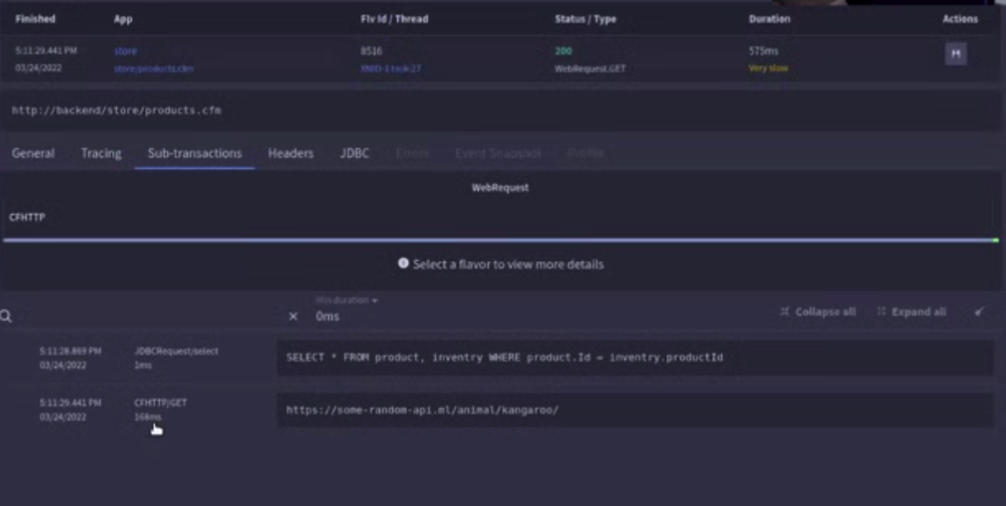
What is monitored in a current transaction?
So here we can see, that we have a call to our products page in our store app. You can see that it has two sub transaction,
- It has a JDBC select
- That we are using an API – but we can’t tell what it does
As soon as the trace goes to an external system we lose the context of the trace. The trace ends when it leaves our system. We just get a timestamp of when it leaves our system and when it returns again. What we don’t have is the detail of what happened in the external system.
Why is distributed tracing better?
Distributed tracing gives you end to end tracing. It allows you to follow the trace from your application, through external services and back again.
Moving to the new FusionReactor Explorer UI
In the UI you can see all of your services, your span routes and your span names
And that’s because the trace context ends at this point. It’s not passed forward to the next trace where it can all be linked together. And that’s where distributed tracing and using tracing rather than transactions gives us a benefit. So with tracing currently, I do need to utilize our new Explore UI.
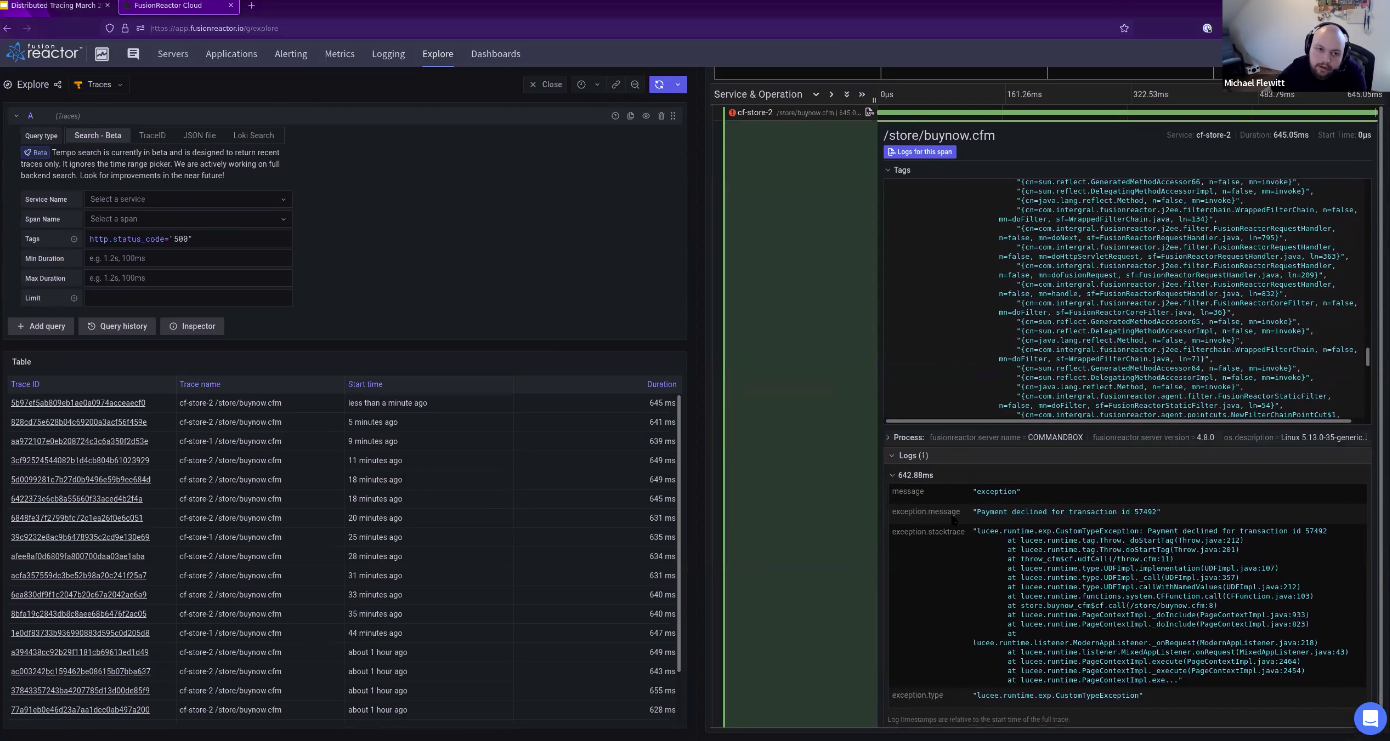
We can look and filter by tags and by durations. So for example, we can filter on all status 500s. When we run this search we can see lots of “buy now” pages with errors. If we look at the trace itself we can see that it has no children and it didn’t interact with the database.
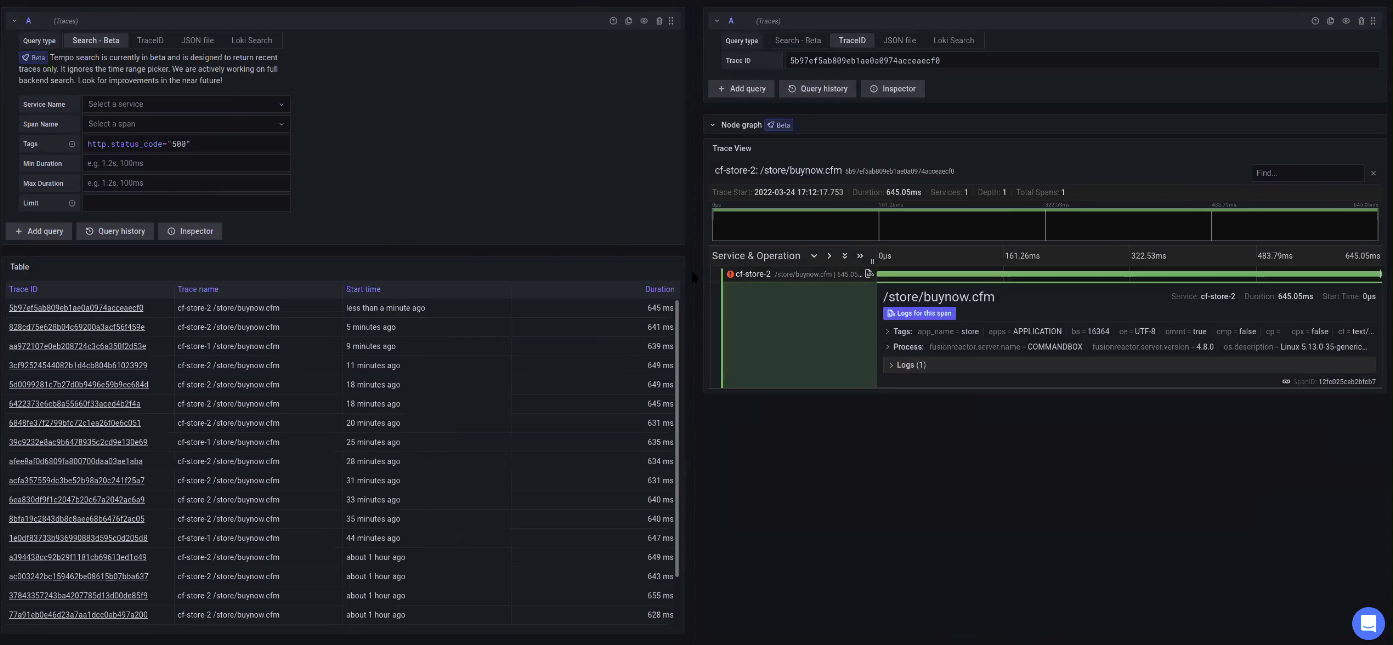
Filter traces to see what’s important
We can do tags like status codes, and we can do duration. So for example, I can filter any request that has a status code, of 500. I use that with a text search. I run this, and then here I have lots of “buy now” pages that have errors attached to them. So if I view the trace itself, we can see here, that it has no children, it didn’t do any database or anything like that. We have tags for metrics and can even run a full stack trace, or link to the logs. In this case, the log tells us that we had a payment declined exception.
From here you can see both tags and metrics and you can link to logs and even run a stack trace to see the code. This enables you to see the traces, the logs and the stack trace all in a single view.
Follow a trace across all services and languages
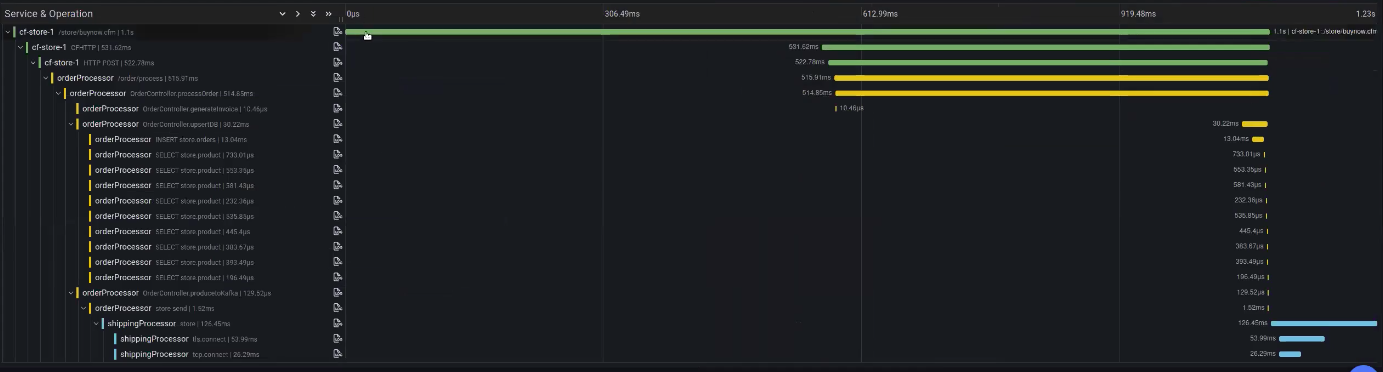
The distributed trace will give us a full view of everything that went on in both internal and external services
In our example Store application we can see that:
- Someone calls our buy now CFM page.
- This is the HTTP post to our order processor,
- which calls the process order method,
- generates the invoice,
- upserts the DB with some SQL queries,
- producers to Kafka and then our shipping process that picks off Kafka and does some HTTP requests based on this.
A holistic view across all microservices
So this is a full distributed trace, so, observability into a distributed system. A standard trace will only tell you that an error occurred somewhere in an external service but a distributed trace will give you the exact details of the issue. So the big advantage of using distributed tracing is the amount of time it saves you in finding the route cause of your issue.
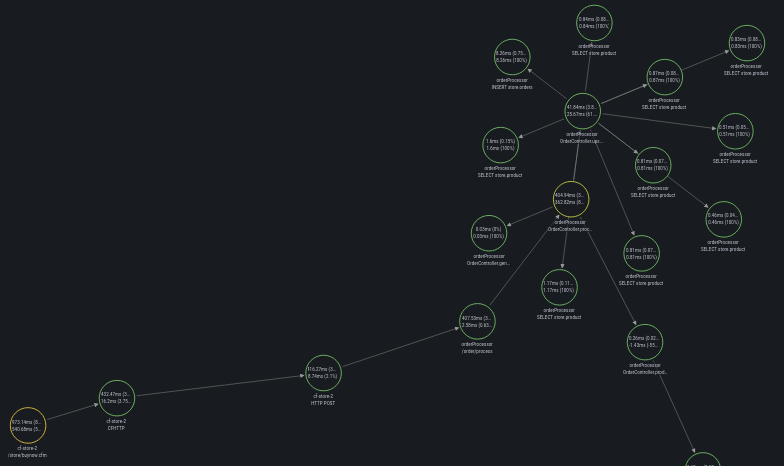
Visualize distributed tracing with a Node graph
We can also visualize the distributed trace as a Node graph. The chart details the request as
it moves through your microservices. From someone placing an order, to CF HTTP to Order processor, to invoice generation, database calls and finally to shipping in Kafka. Take a look at the video which explains the journey in more detail.
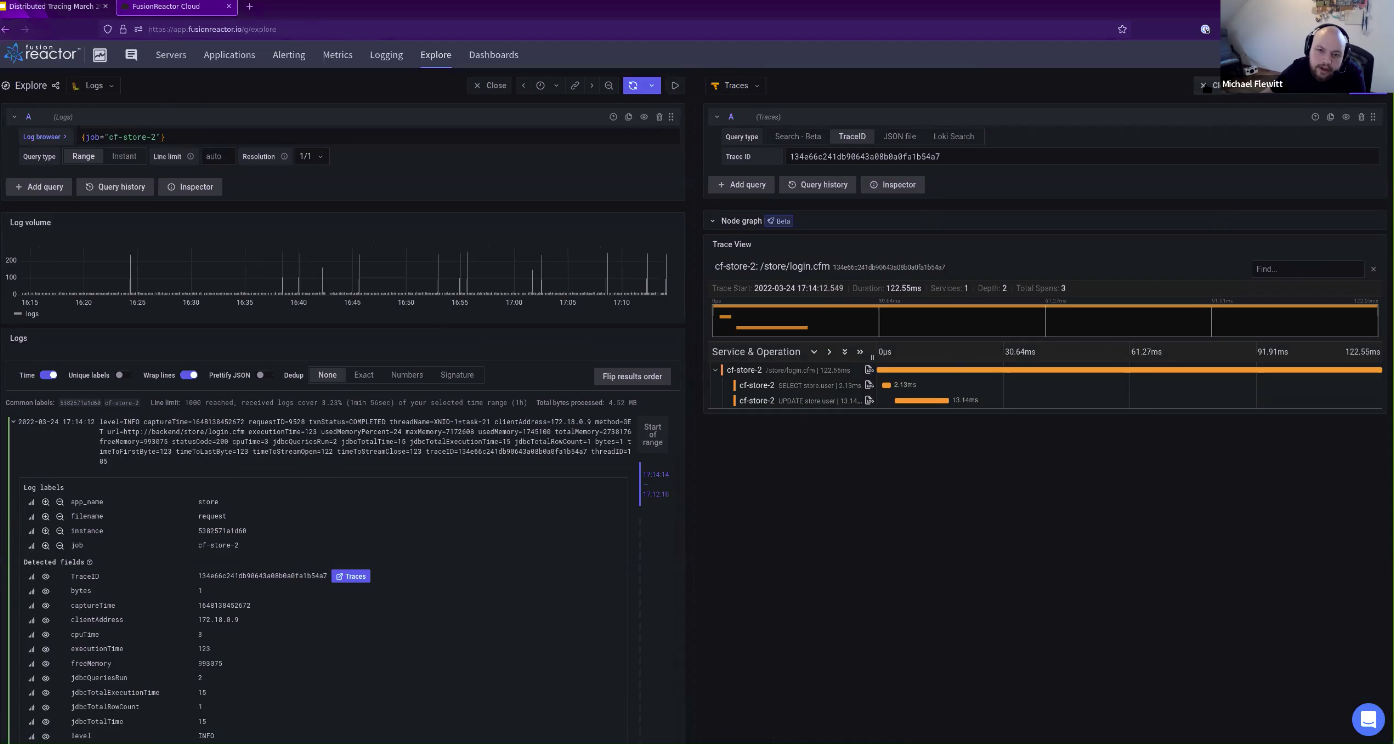
Looking at the log field using Explore
The FusionReactor Explore capability will let you dig deep into your log files. If you use Promtail, Logback, or Fluentbit you can ingest any log file from any system into FusionReactor. Explorers can look at any logline from any log that has ever been ingested.
Looking at the logs from our test application we have logs from CF stores, Inventory, shipping and order processing. It’s worth reminding yourself that these are separate services using a multitude of languages.
Because of the nature of the test application, the order processor log doesn’t tell us a great deal – largely because it is a test and very few orders have ever been placed. But it proves that we can see the log field generated from Kafka.
The CF store log is a little busier and here we can see much more data. For example, we can see monitoring logs and stack traces. But what is more interesting we can also see that if a log has a trace ID then we can click the logline and go straight into the trace.
Explore your metrics
Our test app is generating around 750 metrics, now that is a lot of metrics! So within our metrics, we can see lots of metrics that are all mixed up.
- Database metrics
- Node metrics
- Go metrics
- Java metrics
- CF metrics
We can of course filter these down by service, or technology or even search for metric type – CPU for example. Just like with logs, the metrics explorer will let you use LogQL functions for metric aggregation.
Observability into a distributed system
- Ingest external systems and combine them with your application data for a true end to end view of your application and your microservices.
- Distributed tracing – holistic view of all traces across your entire system
- Log Monitoring – combining FR logs with other logs that you capture
- Expanded metrics allow you to use metrics from your other systems with FR metrics
- Language support – 12 languages and growing