
How to debug in production
Debugging in production has always been something that we try our best to avoid, with multiple QA phases, staging environments, and automation to stop production bugs.
Despite this, occasionally a bug will find its way to production, and when it does, we need a strategy to cope with this safely and efficiently.
Gone are the days where you have a bug in production, you report the issue and reproduce it in staging or development. Modern debugging tools now allow you to safely and reliably debug a production environment safely, without disrupting your users and causing downtime.
Is it safe to debug in production?
One of the key concerns people have is the question of is it safe to debug in production? The answer to this is that it can be.
Specific debugging methods, such as a remote debugger in your IDE or dumping error information to the user, are not considered safe.
Other methods such as logging, error context capture, and debuggers designed explicitly for production can be utilized, with varying success levels.
What makes it safe to debug in production?
If you need to debug in production, there are a few things to ensure when doing so;
- Debugging does not have an extensive performance hit.
- Debugging does not block people from using your application.
- Secure data is not exposed to the outside world.
- You are getting enough debug information to find and fix the issue as soon as possible.
The first 3 points are self-explanatory when debugging you need to keep your application running smoothly and keep the process secure.
Getting all required information when an issue occurs can be challenging, but depending on the complexity / severity of the issue, it can be crucial.
When you debug, you want to get as much information about the issue in the least time possible. If you have to jump between multiple systems and iterate over the errors several times to fix the bugs, this only adds to the stress of dealing with a critical issue.
Why is using a remote debugger in production not a good idea?
When using these debugger connections, you have to place the JVM into debug mode, which can have an enormous hit on performance compared to without this debug capability.
Suppose you do not already have a debugger connection configured you would also need to restart Java to establish this connection. This is not something you want to be doing in an already stressful situation.
When you hit a breakpoint the entire Java engine stops, if a breakpoint is fired all threads in the engine are paused. Hence, your application effectively becomes unusable until you stop debugging.
Why dumping error information to the user is not a good idea?
If you have an error, dumping all that information to the user and having it fixed via support teams seems like a good solution; however, you have to be careful about what information is being displayed.
A stack trace on an error page may not look the prettiest but can direct you towards the problem and the data contained in the stack trace is typically safe. There may be something in that trace that you do not want the user to see.
Dumping variables such as user data or request / response information to give you more context can carry greater risk as this can contain data such as authorization headers, security information, and personal data that could make your system vulnerable.
How to use logging to debug in production
For a long time, logging in production to debug errors was the industry standard, with tools like Splunk, Elastic, or Papertrail making this easier.
With logging, you can capture data for any errors, so you have context when they occur. In some languages like Node JS or PHP you can add logging at runtime, although this does carry some risk, in languages like Java this is not always possible.
If you rely on logging it is always best to do this as you develop the application and use the appropriate log levels so that there is no flood of logs during regular operation.
When an error does occur and the data is not sufficient, you can add required logs for that error to get the context you need.
- When doing this, there are some things you should consider
- Adding extra logging may require restarting your application
- Logging volume can become excessive and hard to manage
- Pinpointing errors can be problematic when buried amongst other messages.
A better alternative to logging in production?
In 2014 the concept of non-blocking debuggers was introduced as a product, the concept of these debuggers is to capture the stack and variables when an event such as an error occurs without blocking the execution of code.
This gives you a picture of what happened when an error occurs so you have the full context of an error automatically. The data captured allows you to hone in on the root cause of an issue without stopping the execution of code or needing any extra logging, debugging tools, or performance impact.
Non-blocking debuggers are great for debugging simpler issues where the root cause of the error is at the top of the stack, if the error is not at the top of the stack you may require further debugging but you will have a much better of where the root cause of the error actually is.
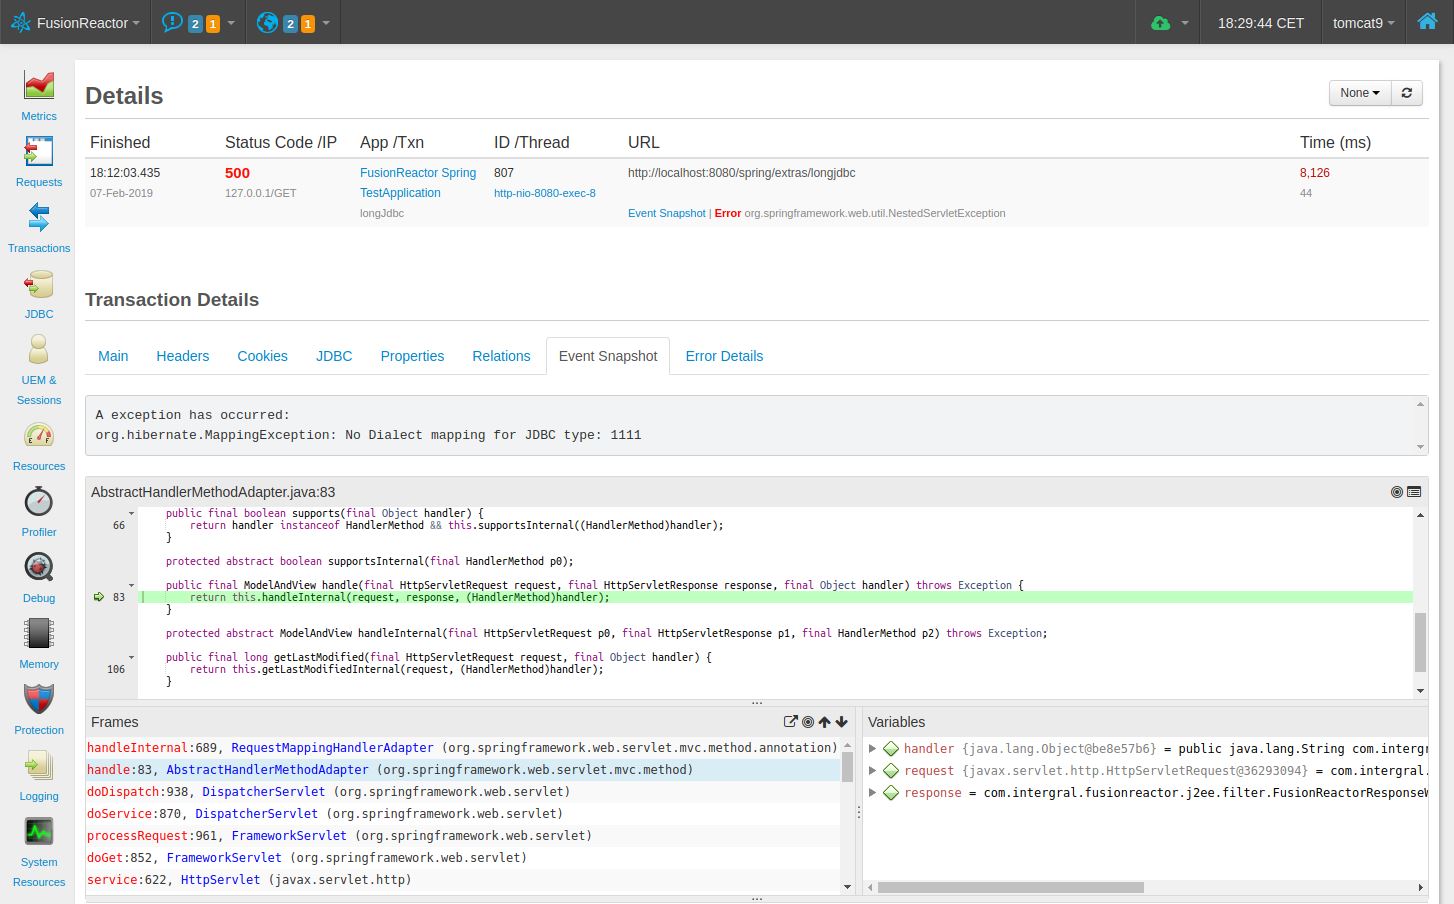
FusionReactor provides a solution called Event Snapshot, when an error occurs, the breaking code, full-stack, and variables will be captured automatically so you can find and fix your errors without the need for any manual work diagnosing the cause of an error.
Can I use a step debugger in production?
I mentioned earlier in the blog that using a remote debugger like the ones included in your IDE on production machines is not a safe practice, but is there an alternative to this that allows you to step through errors?
Some stepping debuggers are explicitly designed to operate in a production environment, so you can pause code, step through and observe state changes without affecting the users of your application.
This is done by limiting debugging to a single thread of an application as opposed to stopping the entire engine and using a combination of conditions so that you will not lock threads in operation where it is not necessary.
For example, you could set a breakpoint with the conditions to only debug if a variable was not set or only on certain accounts, when the breakpoint fires you can set a timeout so the thread is released after a set period of time.
In some cases where you have a severe or complex error and want to diagnose the cause quickly, blocking a single thread or user for a short period of time allows a diagnosis that gets your application running smoothly is a better alternative than delaying the fix to not interrupt the user.
FusionReactor provides such a debugger, where you can set a breakpoint on an exception triggering, on method entry or on a specific line of code. Conditions allow you to tune the breakpoint so that you can debug an issue whilst the rest of your application functions as normal.
How to debug in production – a quick summary
Debugging in production used to be something people actively avoided, but due to the rapidly increasing complexity of applications and the environments around them software is now at a point that this can no longer be the case.
While some methods of debugging such as connecting an IDE are definitely not recommended, there are reliable and safe ways to debug a production issue.
Logging in production will give you the results you need, but may take time to get right and require a restart to two.
Embracing new technologies that assist you in automatically debugging in production by capturing context is something we should embrace in our environments so we are no longer afraid of a production issue.
FusionReactor is one such tool that you should consider including in your environment, with a free 2-week trial