OpenTelemetry and how it will influence FusionReactor
At the core of FusionReactor, we have an agent, and the agent’s task is to instrument the application and capture telemetry in the form of metrics and trace data. Every journey in the world of Observability follows this same pattern – capturing metrics, logs, and traces from the various applications and services executing. The “magic sauce” comes in how your monitoring solution brings that data together and adds additional detail and context so that you are guided to the root of the problem as quickly as possible.
OpenTelemetry (often referred to as OTel) is an open-source project consisting of tools, API, and SDKs, under the Cloud Native Computing Foundation (CNCF) that offers a unified framework for generating, collecting, and transmitting telemetry data. With OpenTelemetry, you can analyze your software’s performance and behavior in a vendor-agnostic way, and then analyze the telemetry data in your backend tool of choice, whether with open-source components, such as Prometheus or Jaeger or commercially available tools.
To understand why OTel’s approach to observability matters for FusionReactor, let’s take a quick look at observability and how it helps organizations transform how they do business.
What is Observability?
Observability lets us understand a system from the outside and allows us to easily troubleshoot our applications and services and answer the fundamental question of “Why is this happening?”.
To be able to answer this question, applications must be properly instrumented. The building blocks of instrumentation are METRICS, LOGS, and TRACES. The combination of being able to analyze these building blocks enables developers to understand their issues better.
Logs, metrics, and traces make up the core of telemetry data.
Logs
Logs represent a time-stamped message emitted by a service or other components. Unlike Traces, however, they are not necessarily associated with any particular user request or transaction. They are found almost everywhere in software and have been heavily relied on in the past by both developers and operators alike to help them understand system behavior. They can be structured, unstructured, or plain text and are usually readable. Logs can be vast and are usually captured in log analysis tools to aid in their analysis and correlation.
Metrics
Metrics are numerical data points represented as counts or measures that are often calculated or aggregated over a period of time. Metrics originate from several sources including infrastructure, hosts, and third-party sources. While logs aren’t always accessible, most metrics tend to be reachable via query. Timestamps, values, and even event names can preemptively uncover a growing problem that needs remediation.
Traces
Traces record the paths taken by requests (made by an application or end-user) as they propagate through multi-service architectures, like microservice and serverless applications – the trace will show how the services connect. Being able to monitor and visualize these connections is critical to understanding how the whole ecosystem of your solutions works and understanding if things are working properly.
Tracing makes debugging and understanding distributed systems less daunting by breaking down what happens within a request as it flows through a distributed system. A Trace is made up of one or more spans. A span represents a unit of work or operation. It tracks specific operations that a request makes, painting a picture of what happened during the time in which that operation was executed. A span contains names, time-related data, structured log messages, and attributes to provide information about the tracked operation.
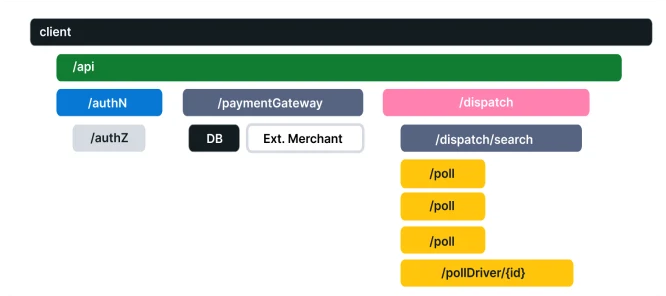
OpenTelemetry Observability Primer – Source: OpenTelemetry Documentation
You can read more about how OpenTelemetry works and what the benefits are in this blog post we published earlier.
FusionReactor and OpenTelemetry give you so much more
Code-level data combined with context has always been the backbone of how FusionReactor has stayed ahead in providing a solution that enables developers to rapidly answer the questions of why something is breaking or why it is performing poorly. By integrating the code-level visibility currently available in FusionReactor, with readily available telemetry available through the OpenTelemetry standards, we will combine the best of both worlds to provide a rich, powerful solution for our customers’ observability needs.