
JProfiler alternatives – Comparing JProfiler with FusionReactor – the battle of the profilers
In this post, we look at the JProfiler alternative FusionReactor and how the two compare. In our previous blog posts, we compared FusionReactor with open source java profiling tools such as GUI-based Java VisualVM, and terminal applications such as jcmd and jstack. We concluded that for production-level profiling, FusionReactor is an undoubted winner. However, in the Java world, JProfiler plays a dominant role in the marketplace, and we’re taking this opportunity to compare it to FusionReactor.
It’s worth mentioning up-front that FusionReactor is marketed as a developer-focused Application Performance Monitor (APM) tool. According to the folks behind the product, they believe that developers are looking for a range of developer-focused capabilities, which combine with metric data to bring a best-of-both-worlds solution to assist with error detection. FusionReactor is also focused on production environments, whereas JProfiler is typically used during development.
JPofiler was developed by people behind ej-technologies and is described as
The Award-Winning All-in-One Java Profiler And indeed this Profiler is no doubt can give deep insights of a running production level application with minimum overhead. The main webpage of JProfiler shows the features that make it the best profiling tool. Today we are going to go through each use case and compare how it can be accomplished by FusionReactor.
Under the Hood
First of all, both tools use the same JVM API to collect statistics of a running Java process – both products use a java agent. We talked more about Java agents in our blog that covers Java VisualVM.
The first difference between the tools comes from how they are attached to the Java process. JProfiler is a desktop tool written in Swing, and to use it, you first have to install the app. The download page provides a downloadable app for many supported operating systems with a pre-installed JRE. After you have installed and launched the profiler, you will have to attach it to the Java process running on a local machine, remote server, or inside of a container.
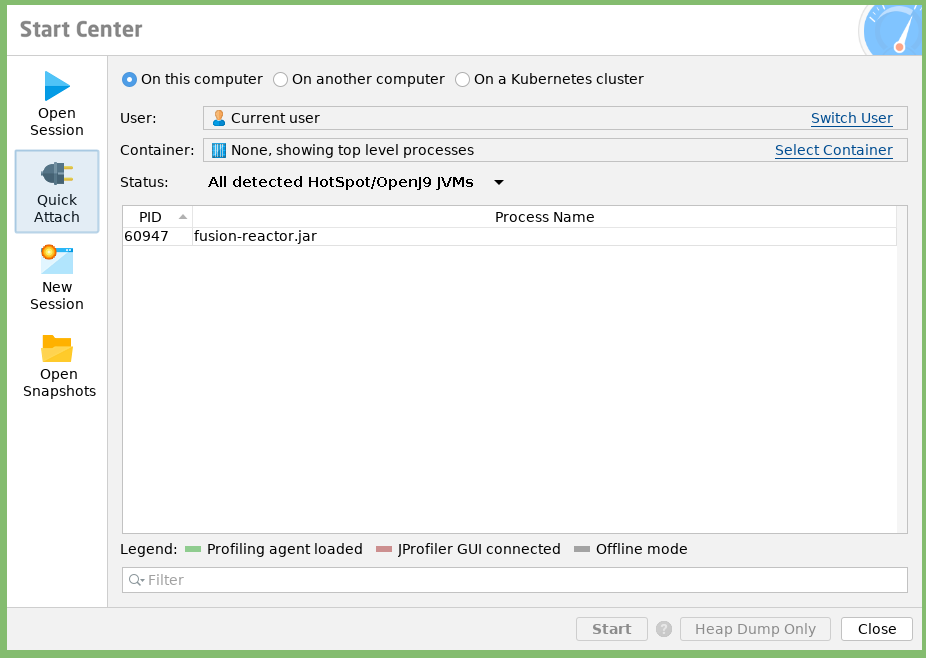
We chose a local java process. After that, you will have to choose a recording method. JProfiler supports sampling and instrumentation. You can read the in-depth description here but in essence, choosing sampling, JProfiler will periodically record the stack traces of each thread while instrumentation will modify the bytecode of application classes to trace methods entries and exits
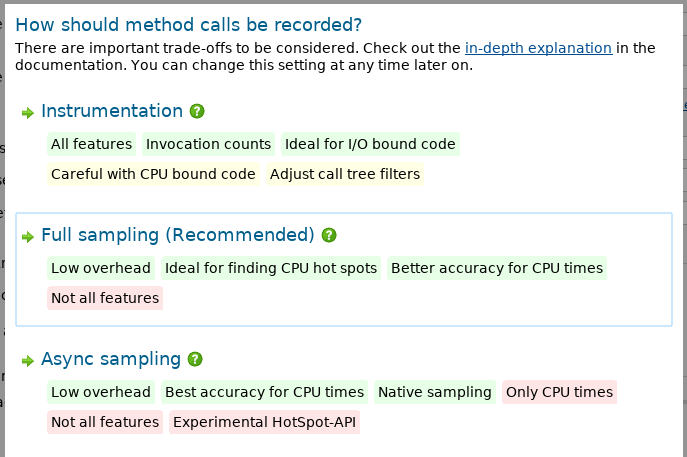
For a fair comparison, we will go with Instrumentation. Finally, you can start profiling your app.
Installing JProfiler – some challenges in production
- First of all, you have to install the executable with JProfiler. With consequent updates, the app must be reinstalled again.
- Secondly, although the range of supported environments is huge it generally requires a lot of effort to install it in production environments. If you want to profile the process in the remote host, you need to enable and configure the ssh-agent in the production machine, which requires some development experience.
Installation of FusionReactor – built for production environments
How is FusionReactor different ? First of all, the interface to FusionReactor is a web app (it has its own tiny webserver for this). You don’t have to install anything on your computer (only install the agent to make it work) which makes non-IT folks’ lives easier. The second biggest difference comparing FusionReactor to JProfiler is that FusionReactor is attached to the Java process on startup. It doesn’t matter where you host your Java application whether it’s a dedicated server, container or even locally. With FusionReactor your production level application is constantly monitored. Again, this makes it really easy (and quick) to install FusionReactor. In my setup test, it took a couple of minutes to install.
FusionReactor Overhead
A few words on overhead of FusionReactor – based on my usage and on information from the vendor, FusionReactor has a performance impact of 1% or less. This is very good for a performance monitoring tool and is IMO is definitely worth the trade-off for the level of information it provides.
Both present clean interfaces which are easy to use
The first selling point that JProfiler uses on their website is “Exceptional ease of use”. We won’t doubt it. The interface is tidy and clean. All buttons are intuitive and anyone familiar with JVM architecture can easily familiarize themselves with the tool and all the metrics being tracked.
FusionReactor also has a clean and intuitive interface. Access to information is available via the menu items down the left hand side of the screen and are grouped into useful collections, such as Metrics, Web Requests, Transactions, JDBC etc. Resources e.g. memory, class loading, threads, CPU & garbage collection can all be found under the Resources menu.
Again, it’s worth mentioning that FusionReactor covers a lot more functionality that pure profiling. It’s more like an all-round monitor + profiling + debugging, all rolled into one. For this reason, the UI can seem a little “overwhelming” in that there are a lot of features.

JProfiler has a few primary tabs that help you to track your application. Let’s compare each of them with what FusionReactor can offer.
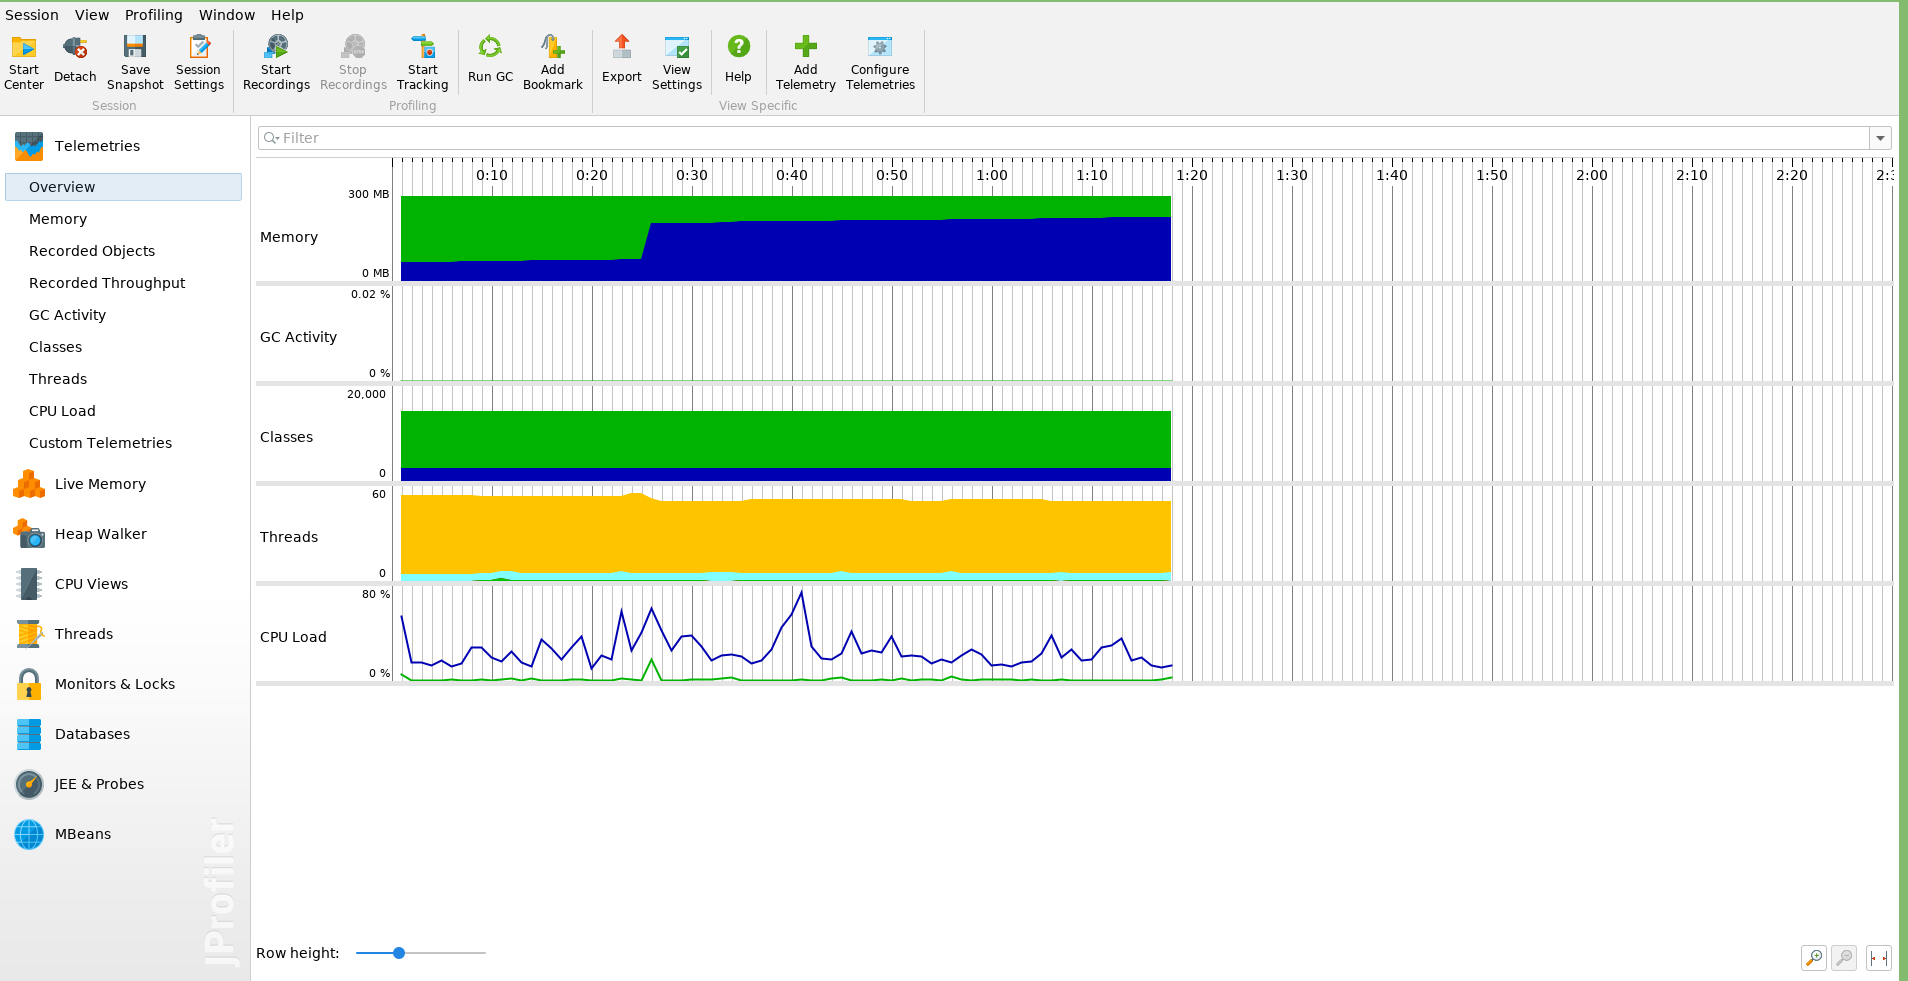
Telemetry / Metrics
Shows top-level information about your app (total memory, GC activity, loaded classes, Threads, and CPU load)
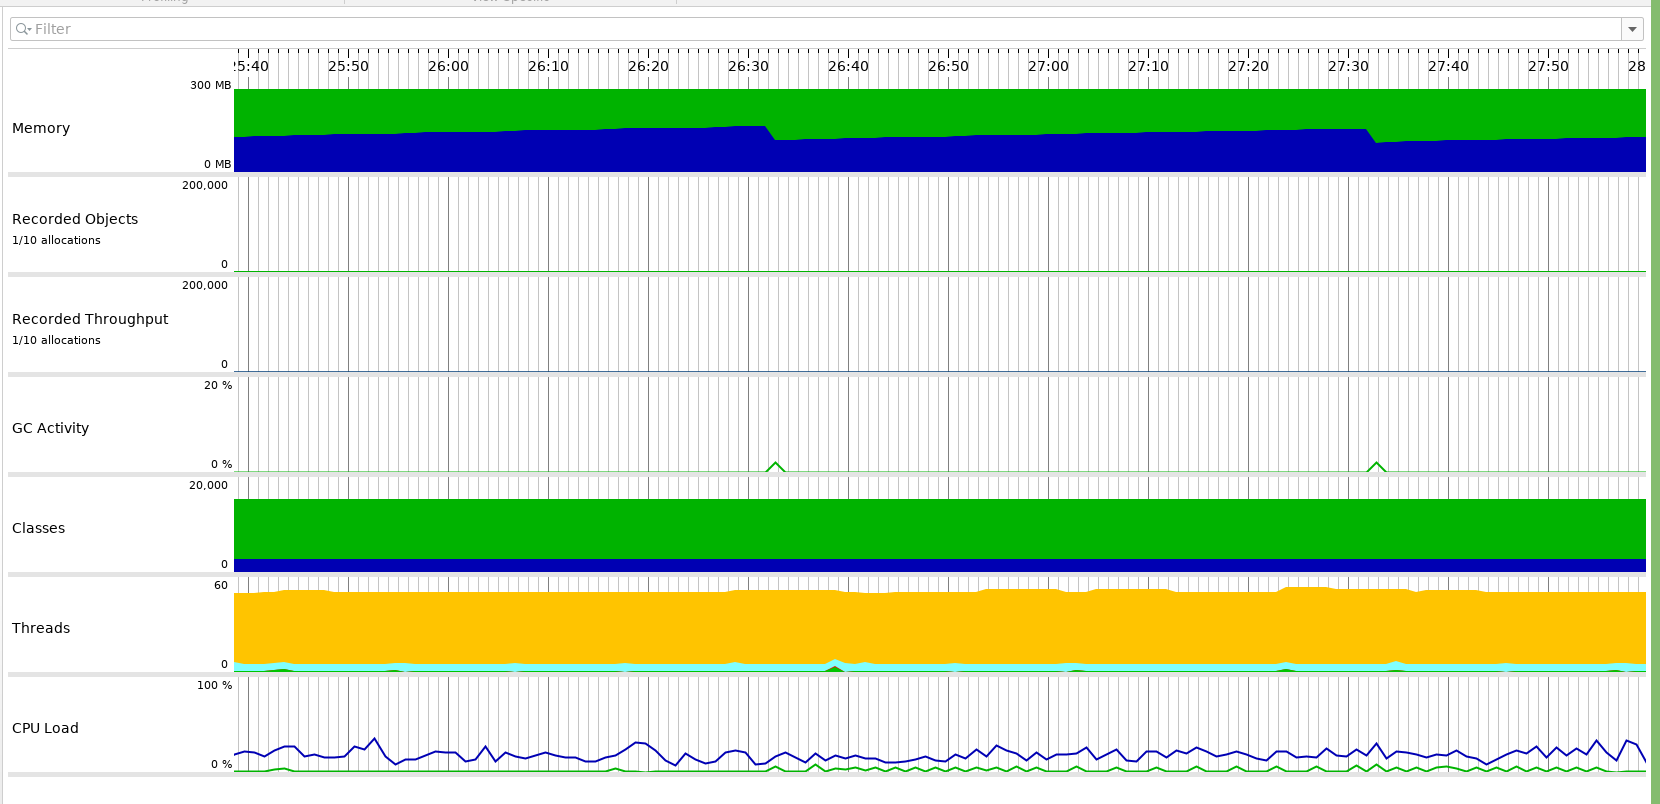
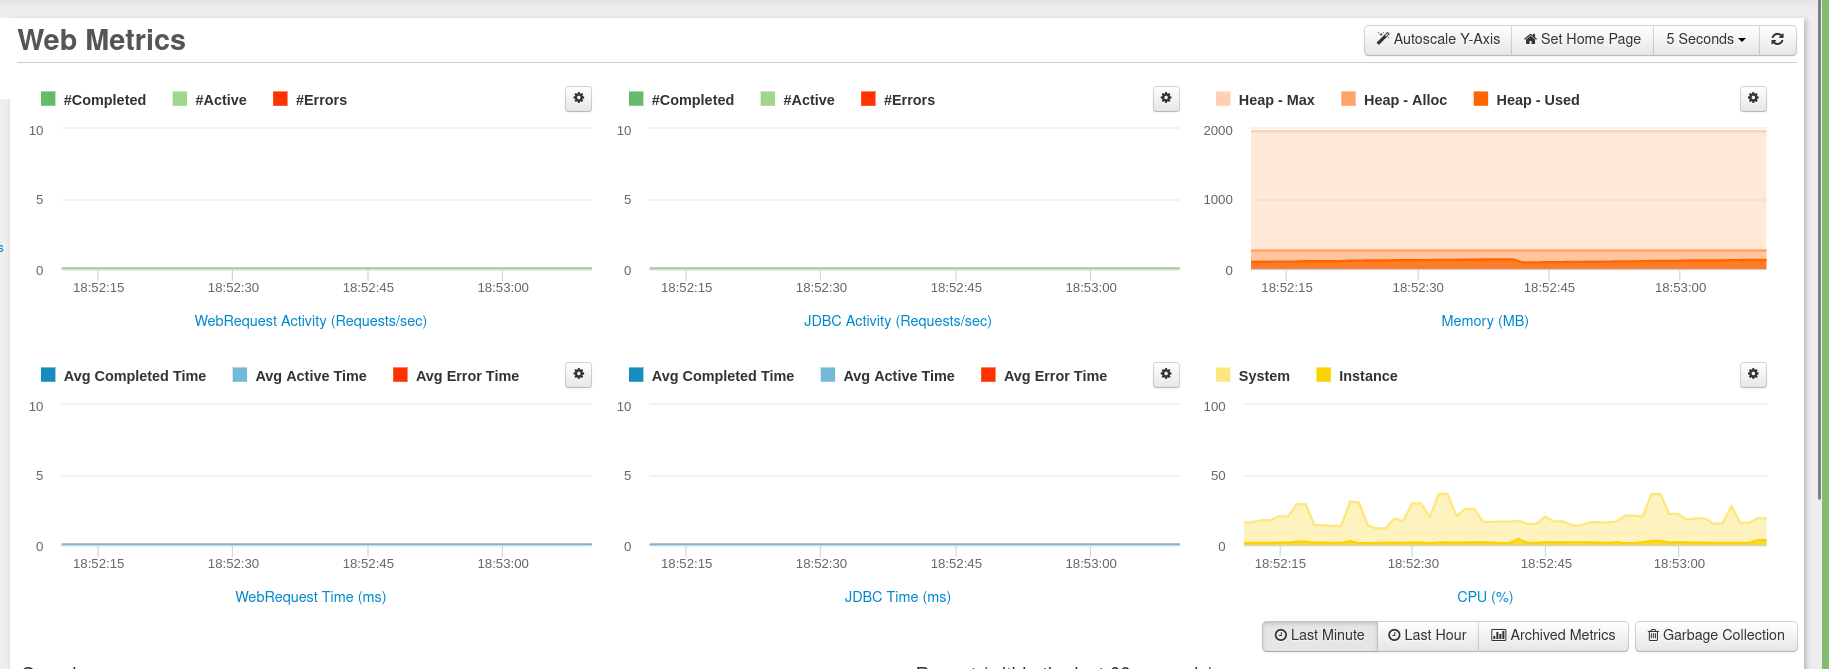
FusionReactor’s has several pages were combinations of metrics are displayed. The default page shows the Metrics tab, which also covers web-based metrics. Live memory – real-time memory allocated by each object in the heap – plus lots of instance / application related information such as number of errors received, throughput, server up-time etc. FusionReactor has specific pages which enable you to drill into the details.
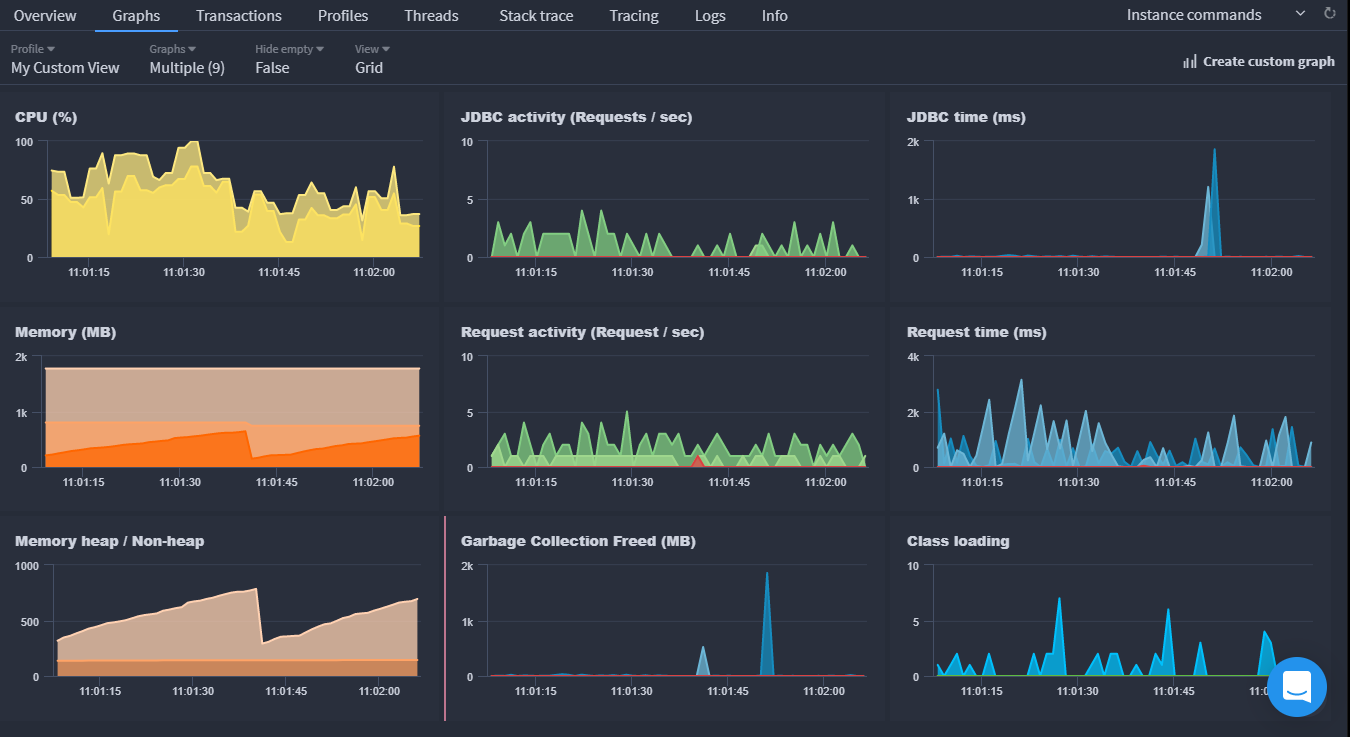
It’s worth mentioning that FusionReactor provides an on-premise interface as standard and also offers a cloud based (SaaS) UI. On the cloud based UI, you can actually configure a collection of any of the available metrics, so that you can build custom views, which is a big advantage over Jprofiler.
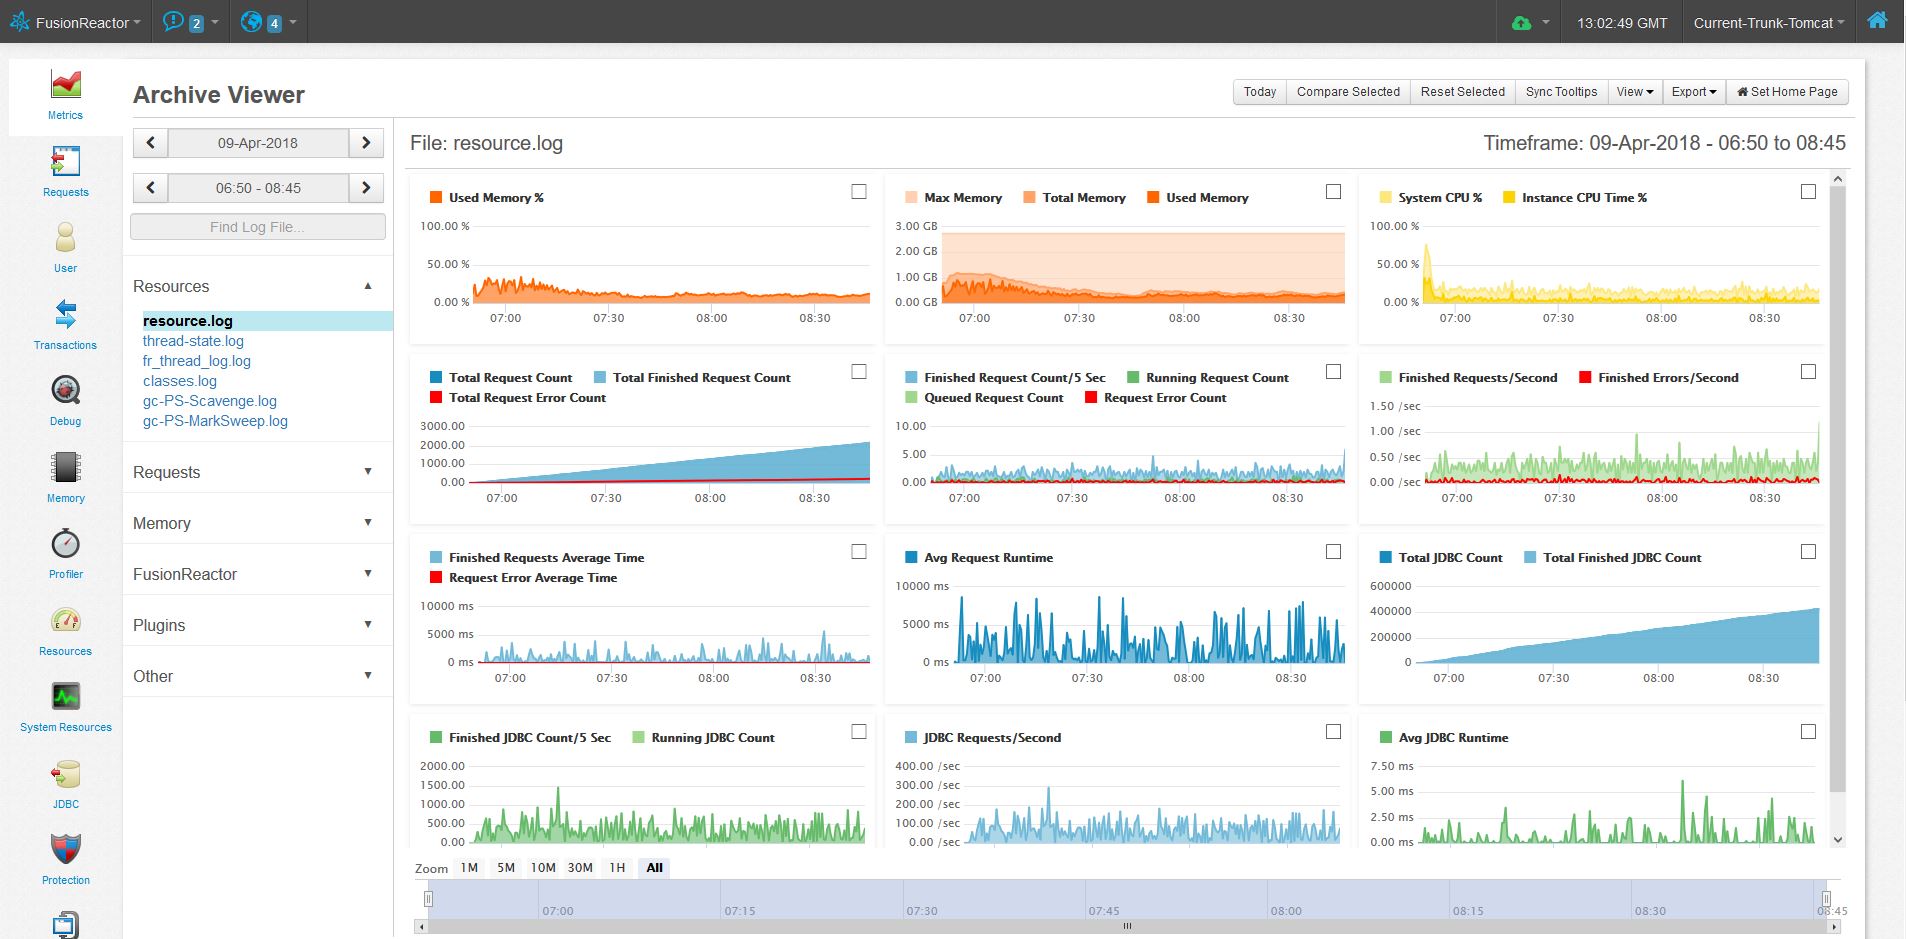
Another interesting point to note is that when running in production, FusionReactor captures all the metrics into log files. These are captured by default and can be rendered through the Archive Viewer. This is actually a great way to look back across time if you know that you had an issue which occurred over the weekend and you would like to see what happened.
Web metrics in Jprofiler alternative FusionReactor
No such information is included in JProfiler
Analyzing the heap – live memory
Analyzing the heap is an important capability as this shows how many objects have been allocated and how much memory those objects are using (in real-time).
Both products have the ability to take a snapshot of the heap, which includes object references and relative heap size (of the class). The general idea is that as a developer you can take snapshots and then look at the delta between two points in time, in order to determine if a memory anomaly is taking place e.g. a memory leak.
Below we can see what this looks like Jprofiler.
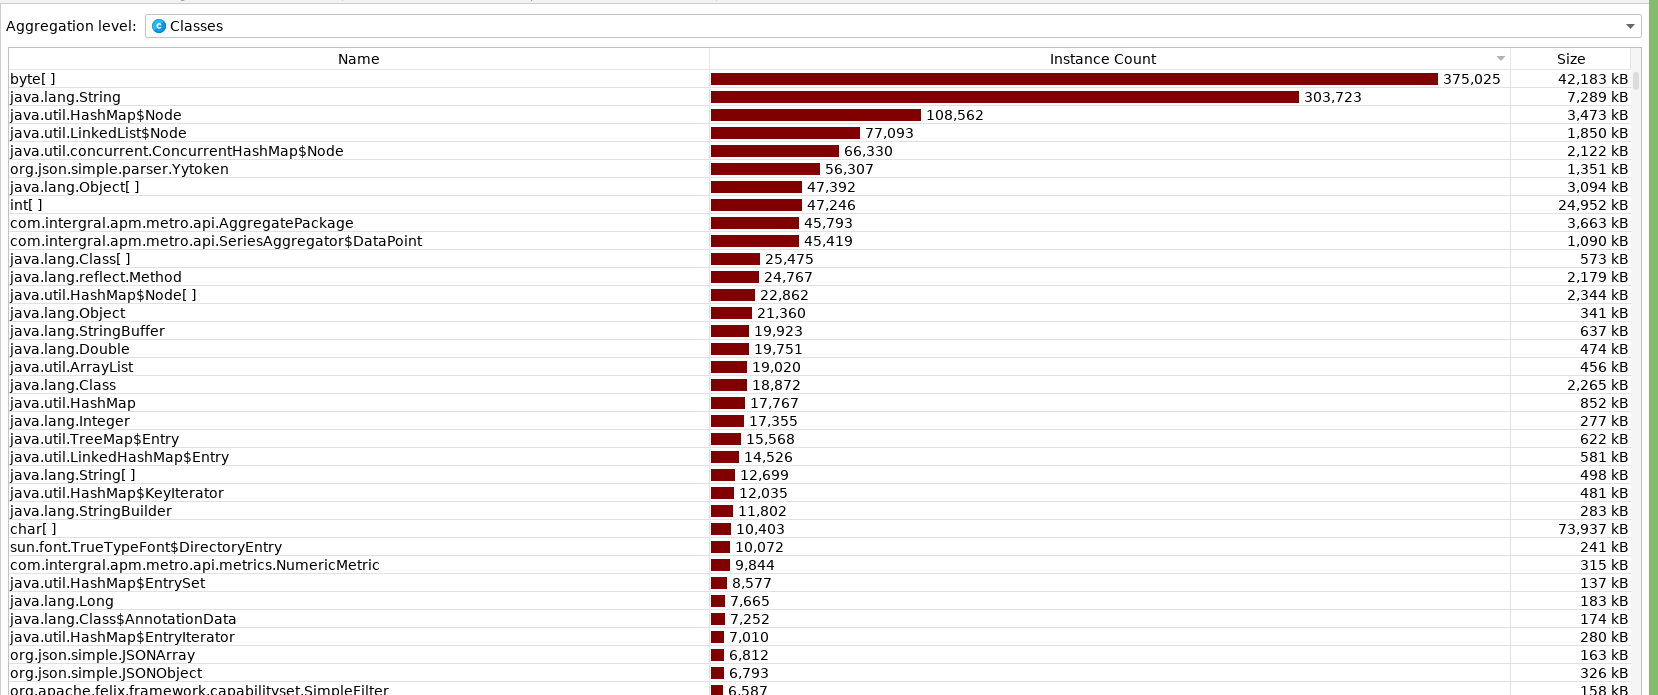
FusionReactor shows the same information as Jprofiler, but also includes some additional information which can be useful. You can find this view underneath the Memory Tab.
FusionReactor shows you the percentages of memory used as well as objects allocated.
The image below also show FusionReactor’s diff function, which compares all of the class related object and memory information compared across the two points in time.
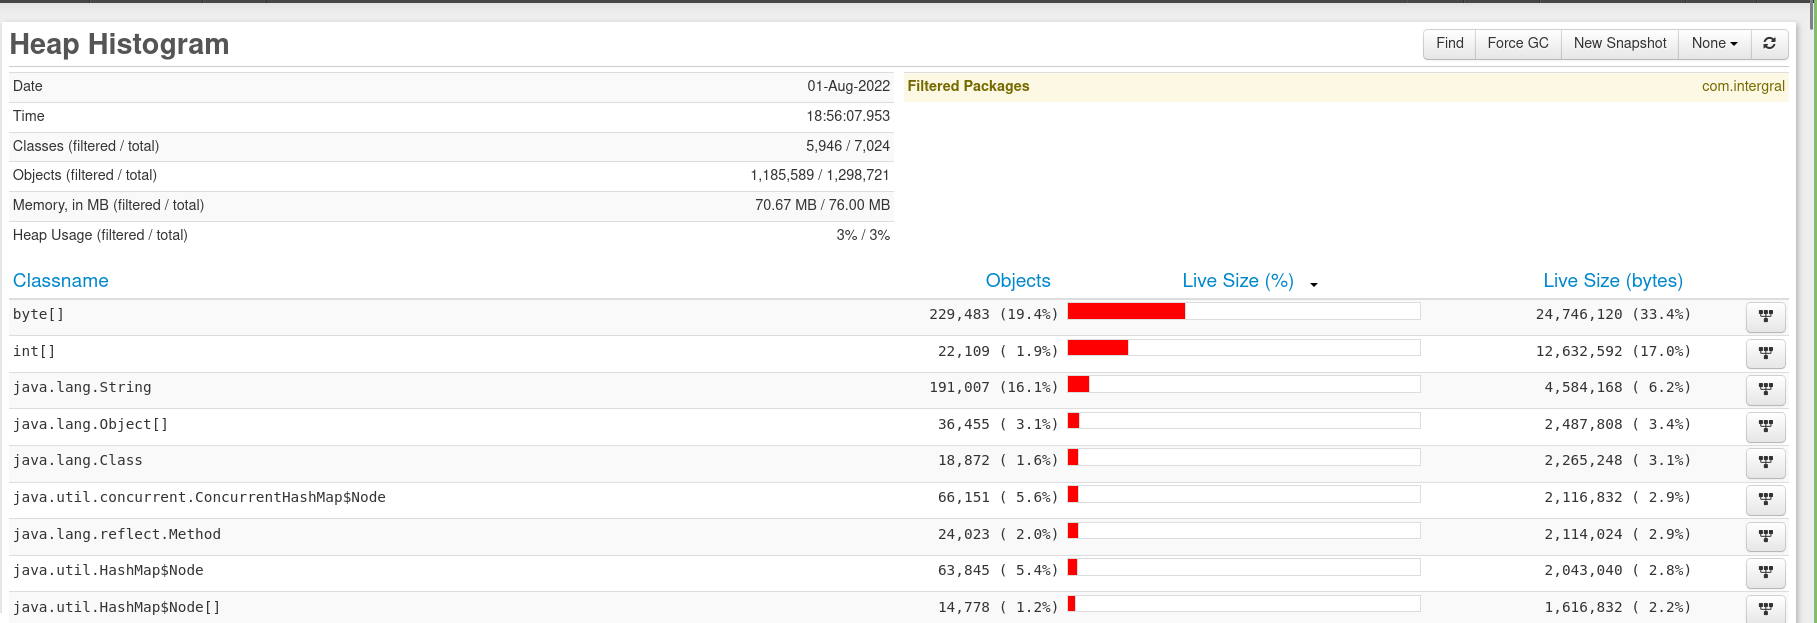

On the right side you will see an icon. If you click this icon, then FusionReactor will drill into the GC Roots, corresponding to the selected class.
GC root is a term used in the context of garbage collection in Java. These are defined as being special objects for the garbage collector and are the starting points for the garbage collector processes. In general, all objects directly or indirectly referenced from a GC root are not garbage collected – by analyzing these, it’s possible to get even greater detail into the heap memory utilization.

Threads
List all of the application threads with their states
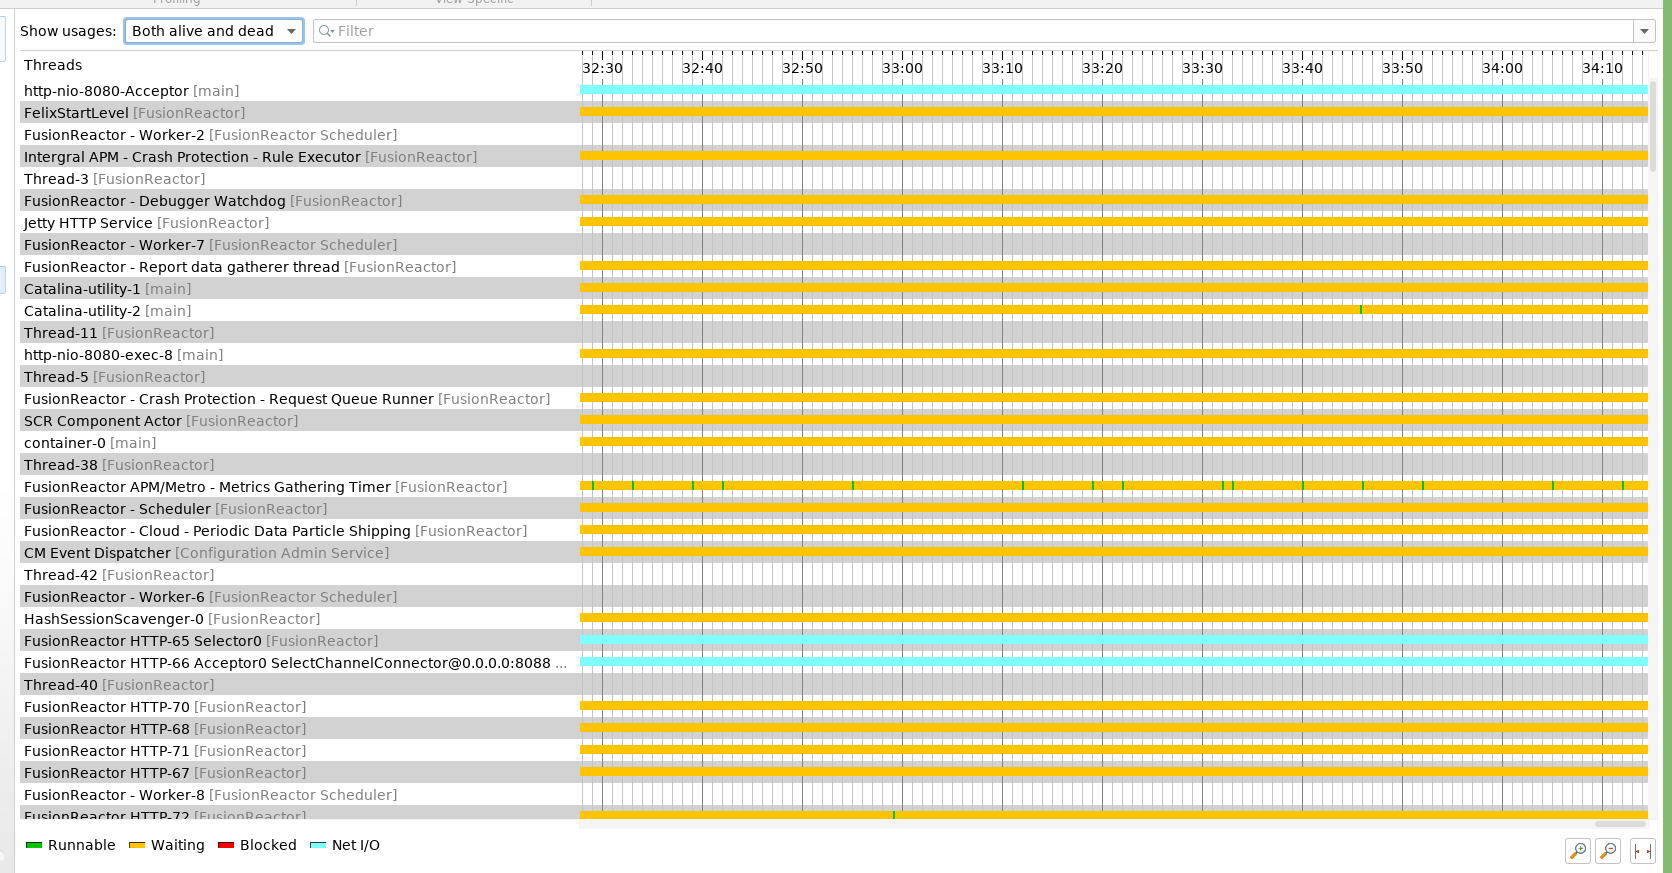
In the Jprofiler alternative FusionReactor Resources tab, you can see the same list of threads.

Monitoring threads – FusionReactor has the advantage
A common method of spotting anomalies is to inspect running threads. This can highlight performance problems or by analyzing thread state, can indicate if a thread is not behaving as expected. FusionReactor offers several options to analyze threads in real time. An added bonus is that you can perform different actions on threads as they’re executing. These include:
- Killing a thread – in some cases this is a fantastic feature – BUT – in certain cases, killing a thread may de-stabilize the JVM, which obviously isn’t desirable. FusionReactor will warn you about this and in cases where it would clearly cause a problem, killing a thread would not be allowed.
- See the stack trace of a running thread – this is very powerful and will instantly give an overview of the complete call stack. This can be particularly useful when pinpointing some code which is, say waiting on a lock or some resource and therefore blocking the process.
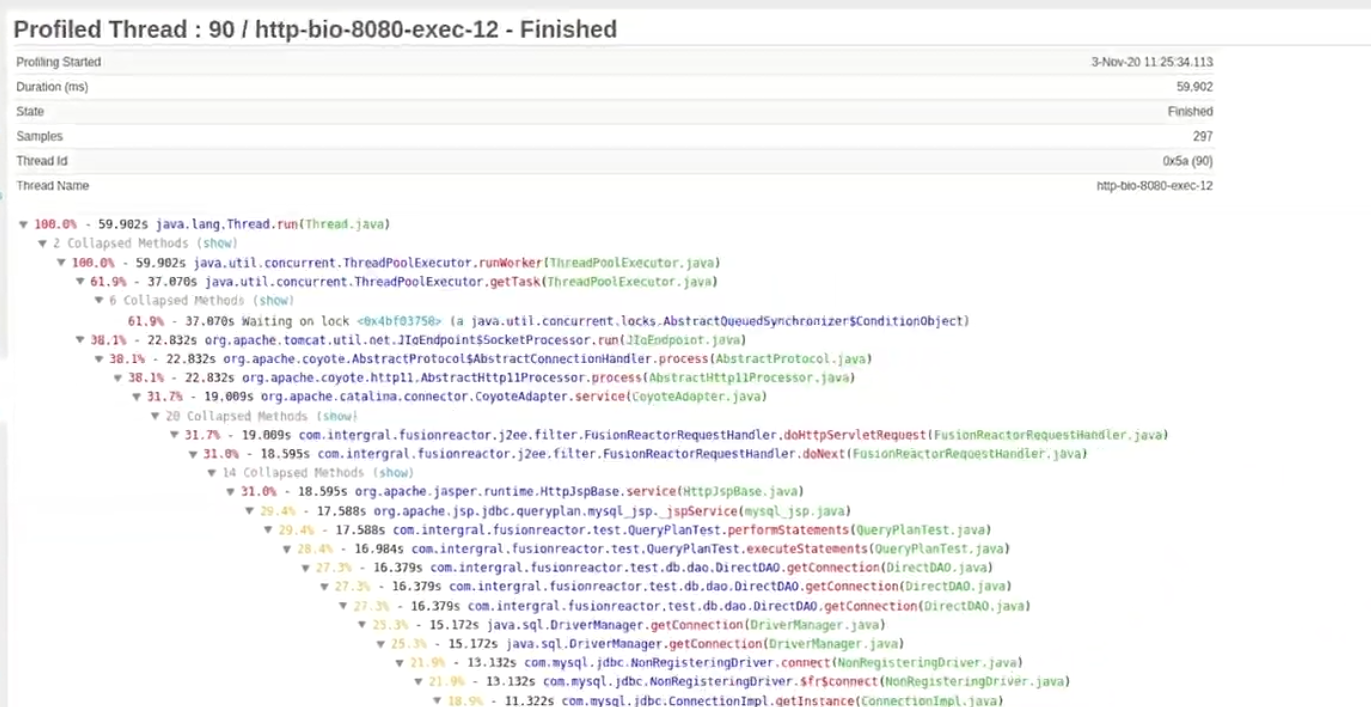
- Instantly profile a thread. FusionReactor includes a “continuous profiler” which will allow a transaction to be profiled as they’re executing. This uses their sampling profiler (not class instrumentation) – the advantage here, is that it provides minimal impact on the running thread. The resulting profile is however, very useful and will show you time spent as well as the percentage of all time spent within a specific method.
CPU view
Amount of CPU cycles taken by each method shown in Jprofiler.
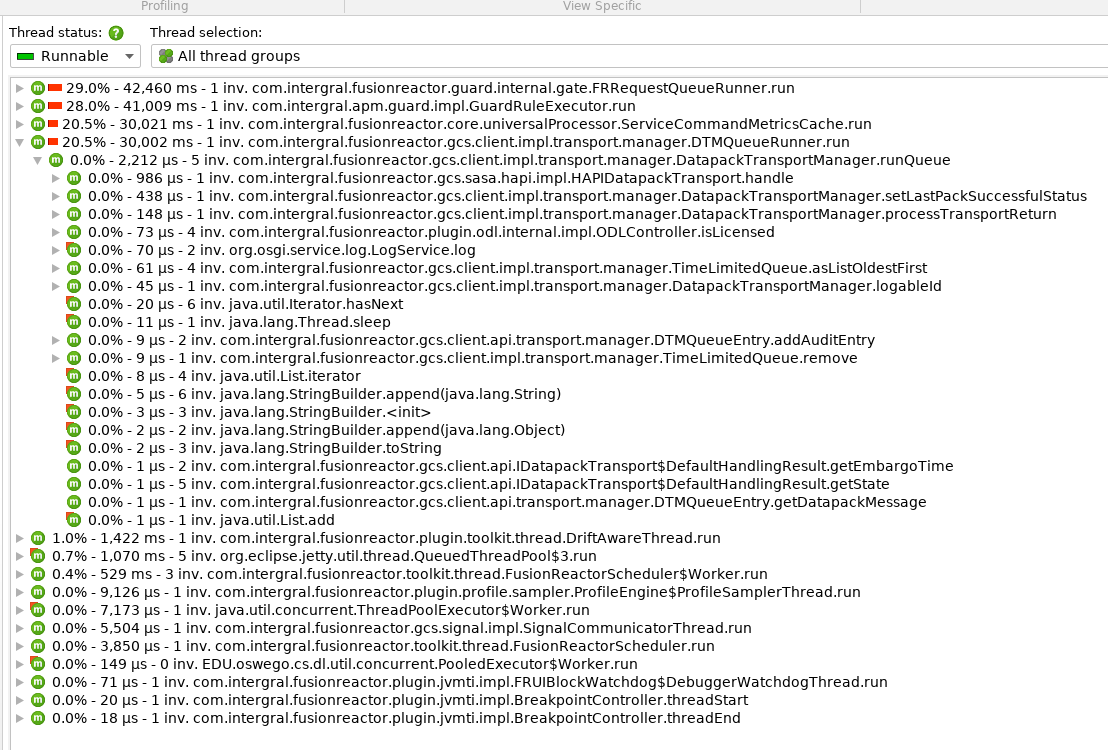
In FusionReactor, using the Transactions tab, you can see the CPU usage per Thread; by clicking on the thread, you will see the page similar to JProfiler.
It’s also possible to generate a stack trace, pause or profile a thread as discussed earlier.
Database analysis
All JDBC calls made by your app (other non-JDBC-based protocols are supported, too, for example, Cassandra and HBase)
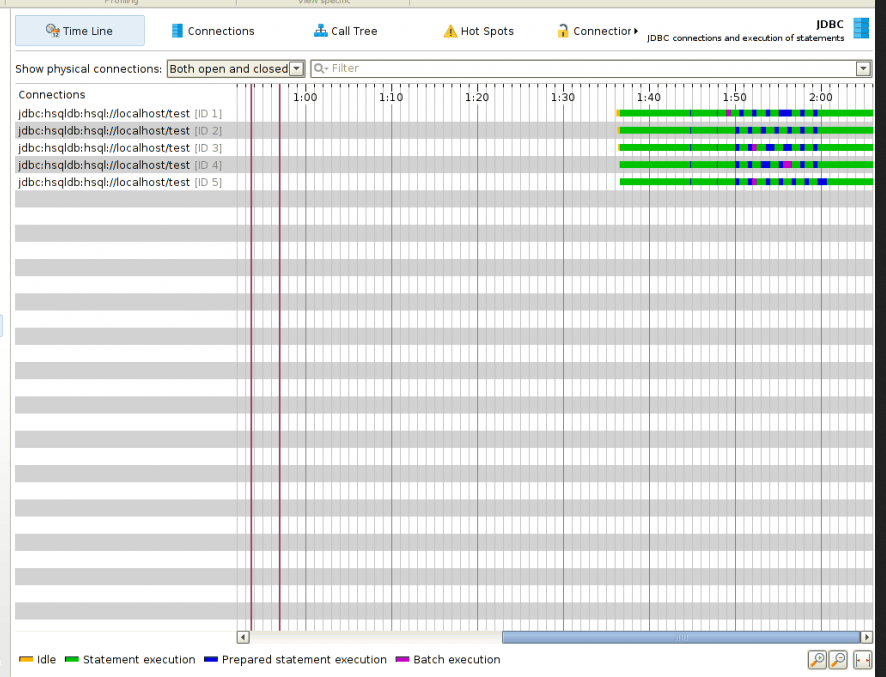
The JDBC tab in Jprofiler alterative FusionReactor shows you the history of all JDBC queries, whether it was a plain JDBC or higher level JPA framework. As the focus is more on troubleshooting, FusionReactor also provides specific views, showing.
- Slow running queries (last 100)
- Longest running queries (last 100 all time)
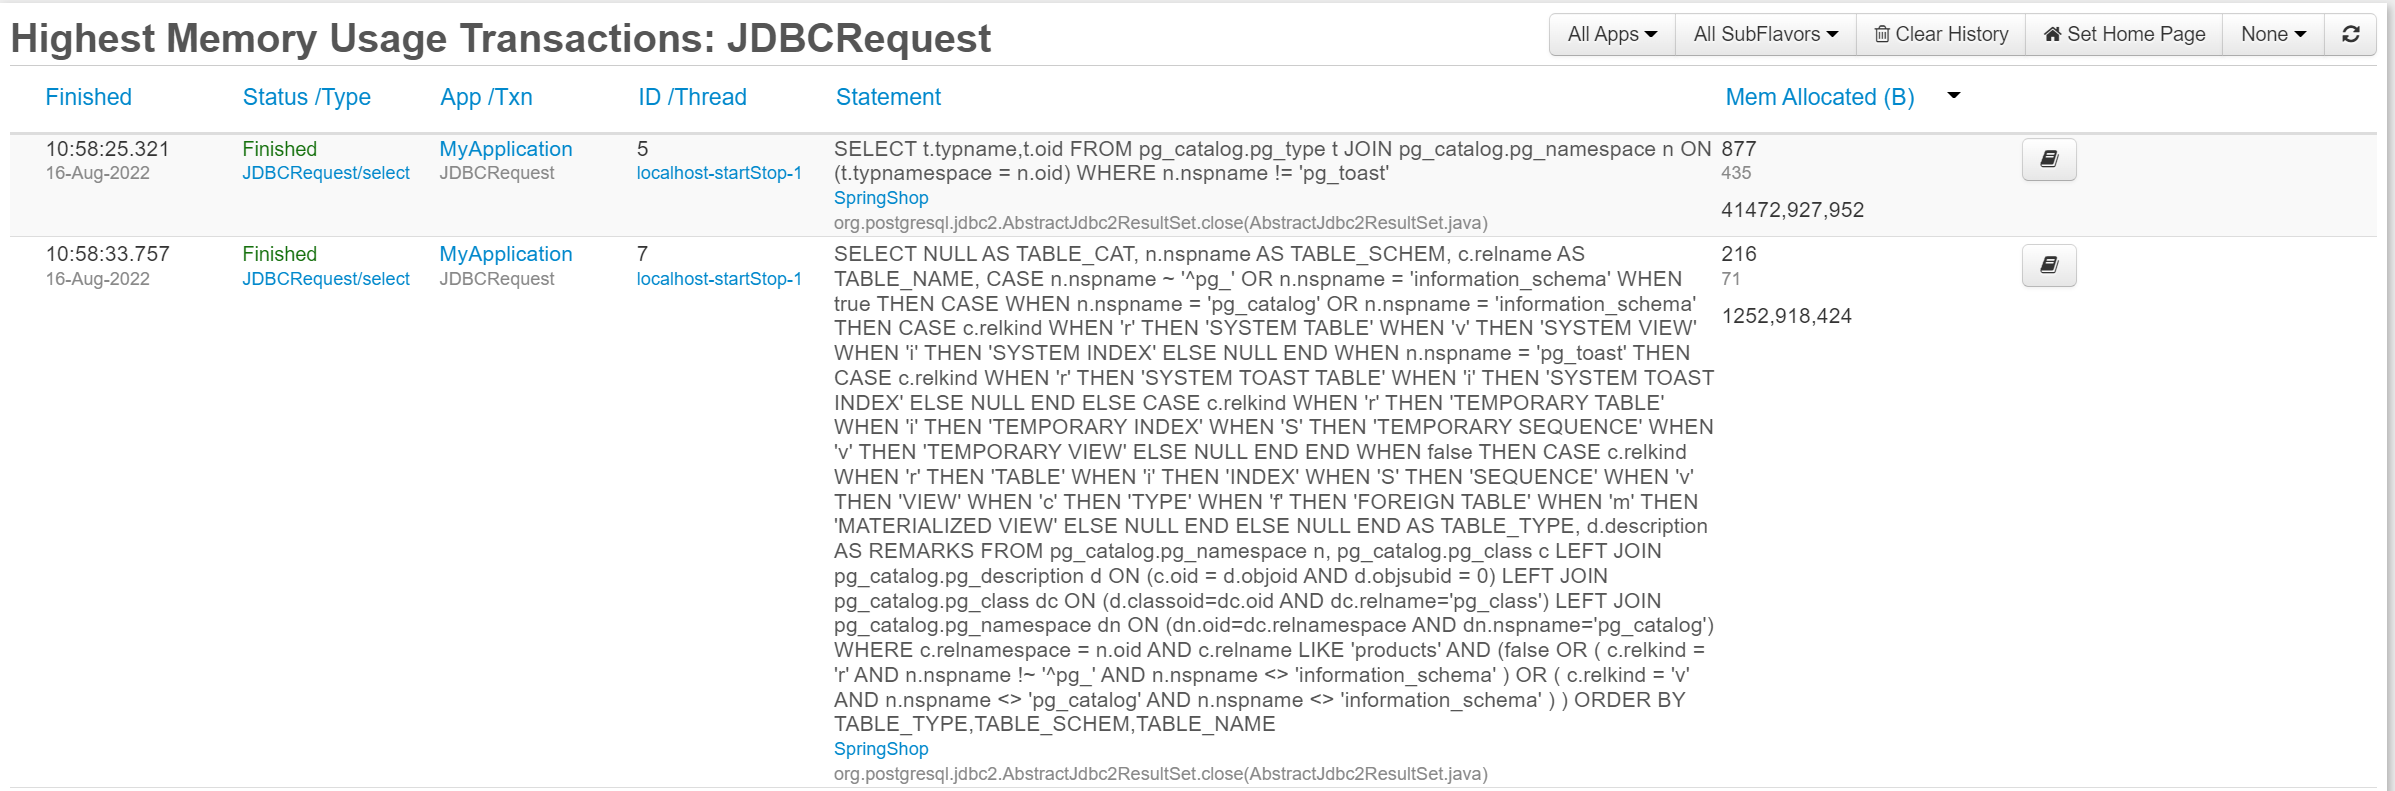
- Queries using the most heap (which can be really useful when analyzing a memory related issue in a query e.g. the query itself may be performing very well – but it consumes a lot of memory – this can easily be seen in FusionReactor – see below)
- JDBC Errors
FusionReactor, supports databases with corresponding JDBC driver implementation (which most of the relational databases do) as well as NO SQL databases, such as MongoDB.

JEE probes
Web-based metrics. It covers the metrics from the HTTP server, amount of exceptions, and information about the sockets. We believe that information provided in the Requests tab is more powerful than Jprofielr and offers a wider variety of metrics and ways to detect the performance issue. First of all, all requests history are persisted
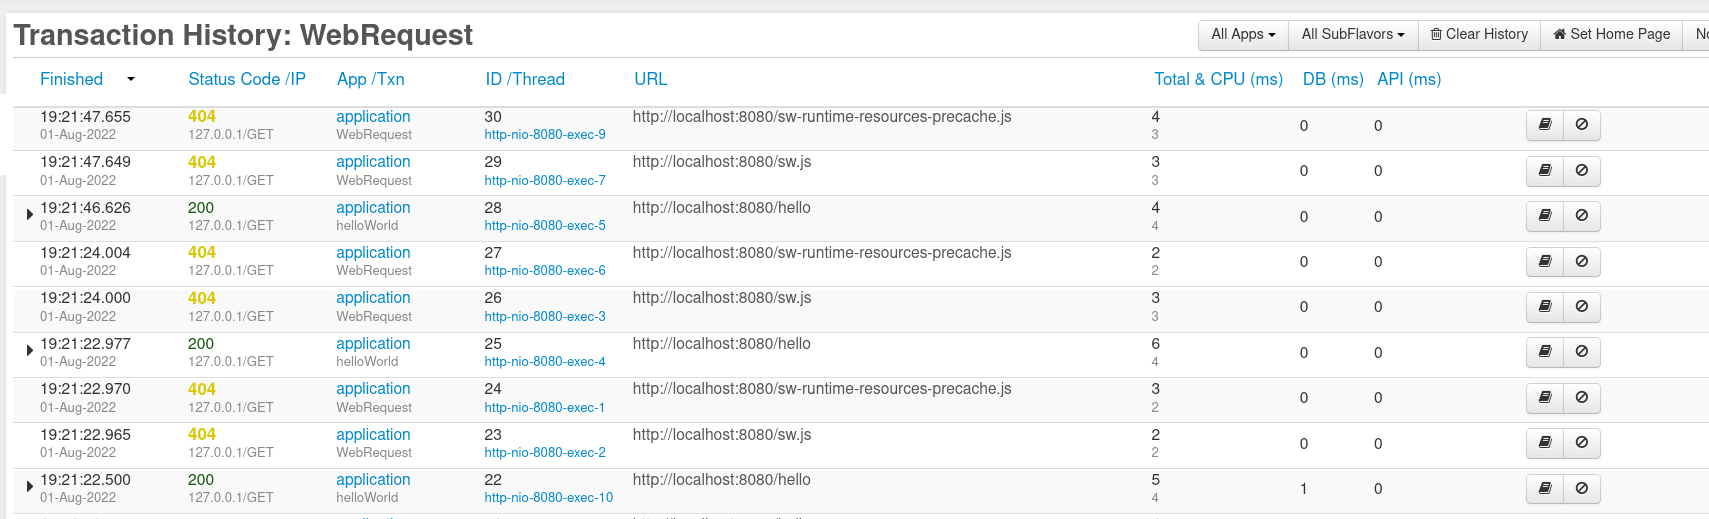
In FusionReactor, requests can be sorted by longest requests and by those which take a bigger amount of memory. You can click on the detail icon next to each request to see the detailed metrics
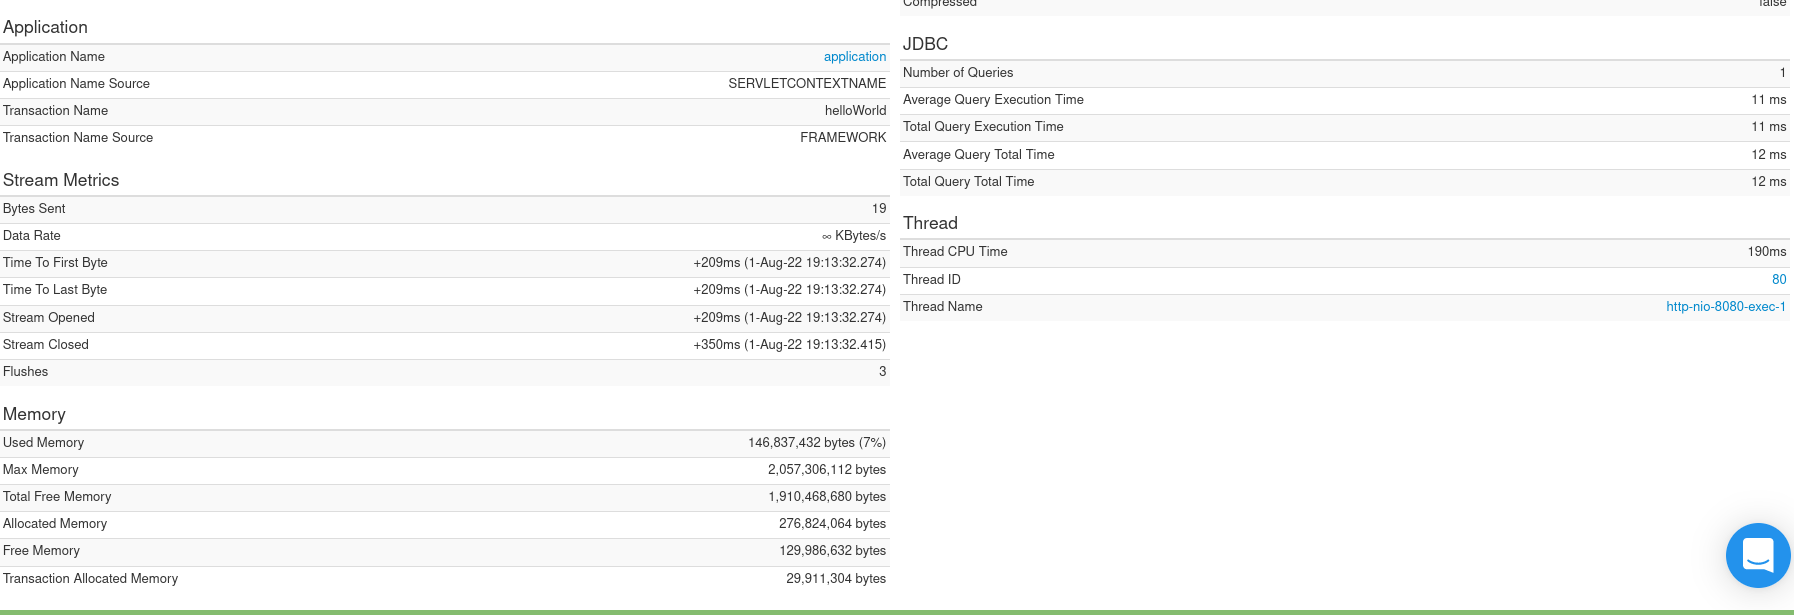
For example, here is the page that shows how much memory it took and the amount of JDBC calls it made.
Zero-configuration remote profiling
Another thing that JProfiler can offer you is zero-configuration profiling of remote java processes. However, need to configure the ssh tunnel. The same can be applied to FusionReactor as well. FusionReactor’s main target is production observability. When you start your app with FusionReactor’s agent attached to it, it exposes the port on the same host machine running the admin panel. Remote profiling for FusionReactor is just a matter of opening this port for remote access.
Built-in support for Docker and Kubernetes
JProfiler has built-in support for containerized environments such as Kubernetes. It’s just a matter of choosing the Pod from the main page, and JProfiler will give you a list of all java processes. With FusionReactor, it’s almost that easy. First, you don’t need to create a Kubernetes service to access the admin panel. All you need to do is to forward ports. Assuming you have kubectl you can use the following command.
kubectl get pods -n <namespace> # get all the pods
kubectl port-forward -n <namespace> <pod_name> 8088:8088 # enable port forwarding
Now you can open the browser and reach out to this URL http://localhost:8088/
Excellent support for Java Enterprise Frameworks
JProfiler supports the most popular Java frameworks such as database access like JPA/Hibernate and web frameworks such as Spring and JavaEE. The same is true for FusionReactor. Both tools can show the lifetime of the HTTP Request in Servlet Container and SQL queries made from JPA.
Integration with application servers and IDEA
JProfiler can monitor java applications that run on top of the application servers, such as Tomcat or any other Servlet Containers. FusionReactor offers the same capabilities. For example, in terms of a Tomcat, FusionReactor needs to be added in the setenv.sh script
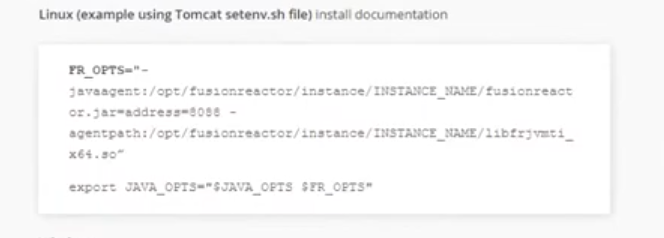
Before you launch the Tomcat server.
What FusionReactor supports that JProfiler doesn’t
Remote Debugging
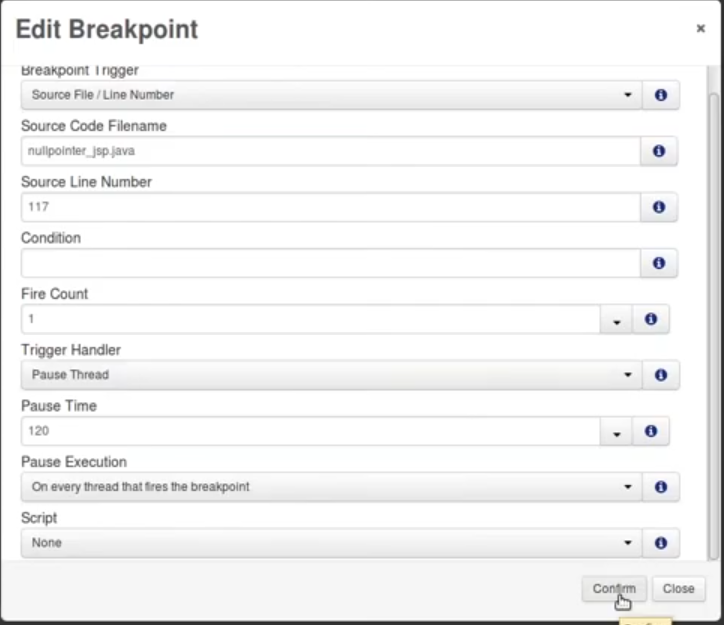
You can attach the debugger to the running process without killing the performance of the underlying application with FusionReactor. By default, only a single Thread will wait on the breakpoint, which won’t disturb your customers from using the app. You can also tell FusionReactor how long the breakpoint can wait for before resuming the execution.
As far as I’m aware, FusionReactor is the only solution of its kind which offers a full debugger, which is built for debugging production environments. The debugger is implemented at the JVMTI level and according to the vendor has a very limited impact on performance. The images below show how a breakpoint can be set directly following an exception taking place – followed by the debug window itself, which is built directly in FusionReactor’s UI.
Before you launch the Tomcat server.
Setting an automatic breakpoint. You can also click on the point in the stacktrace and FusionReactor will instantly decompile your code, so you can set a breakpoint using the built in editor.
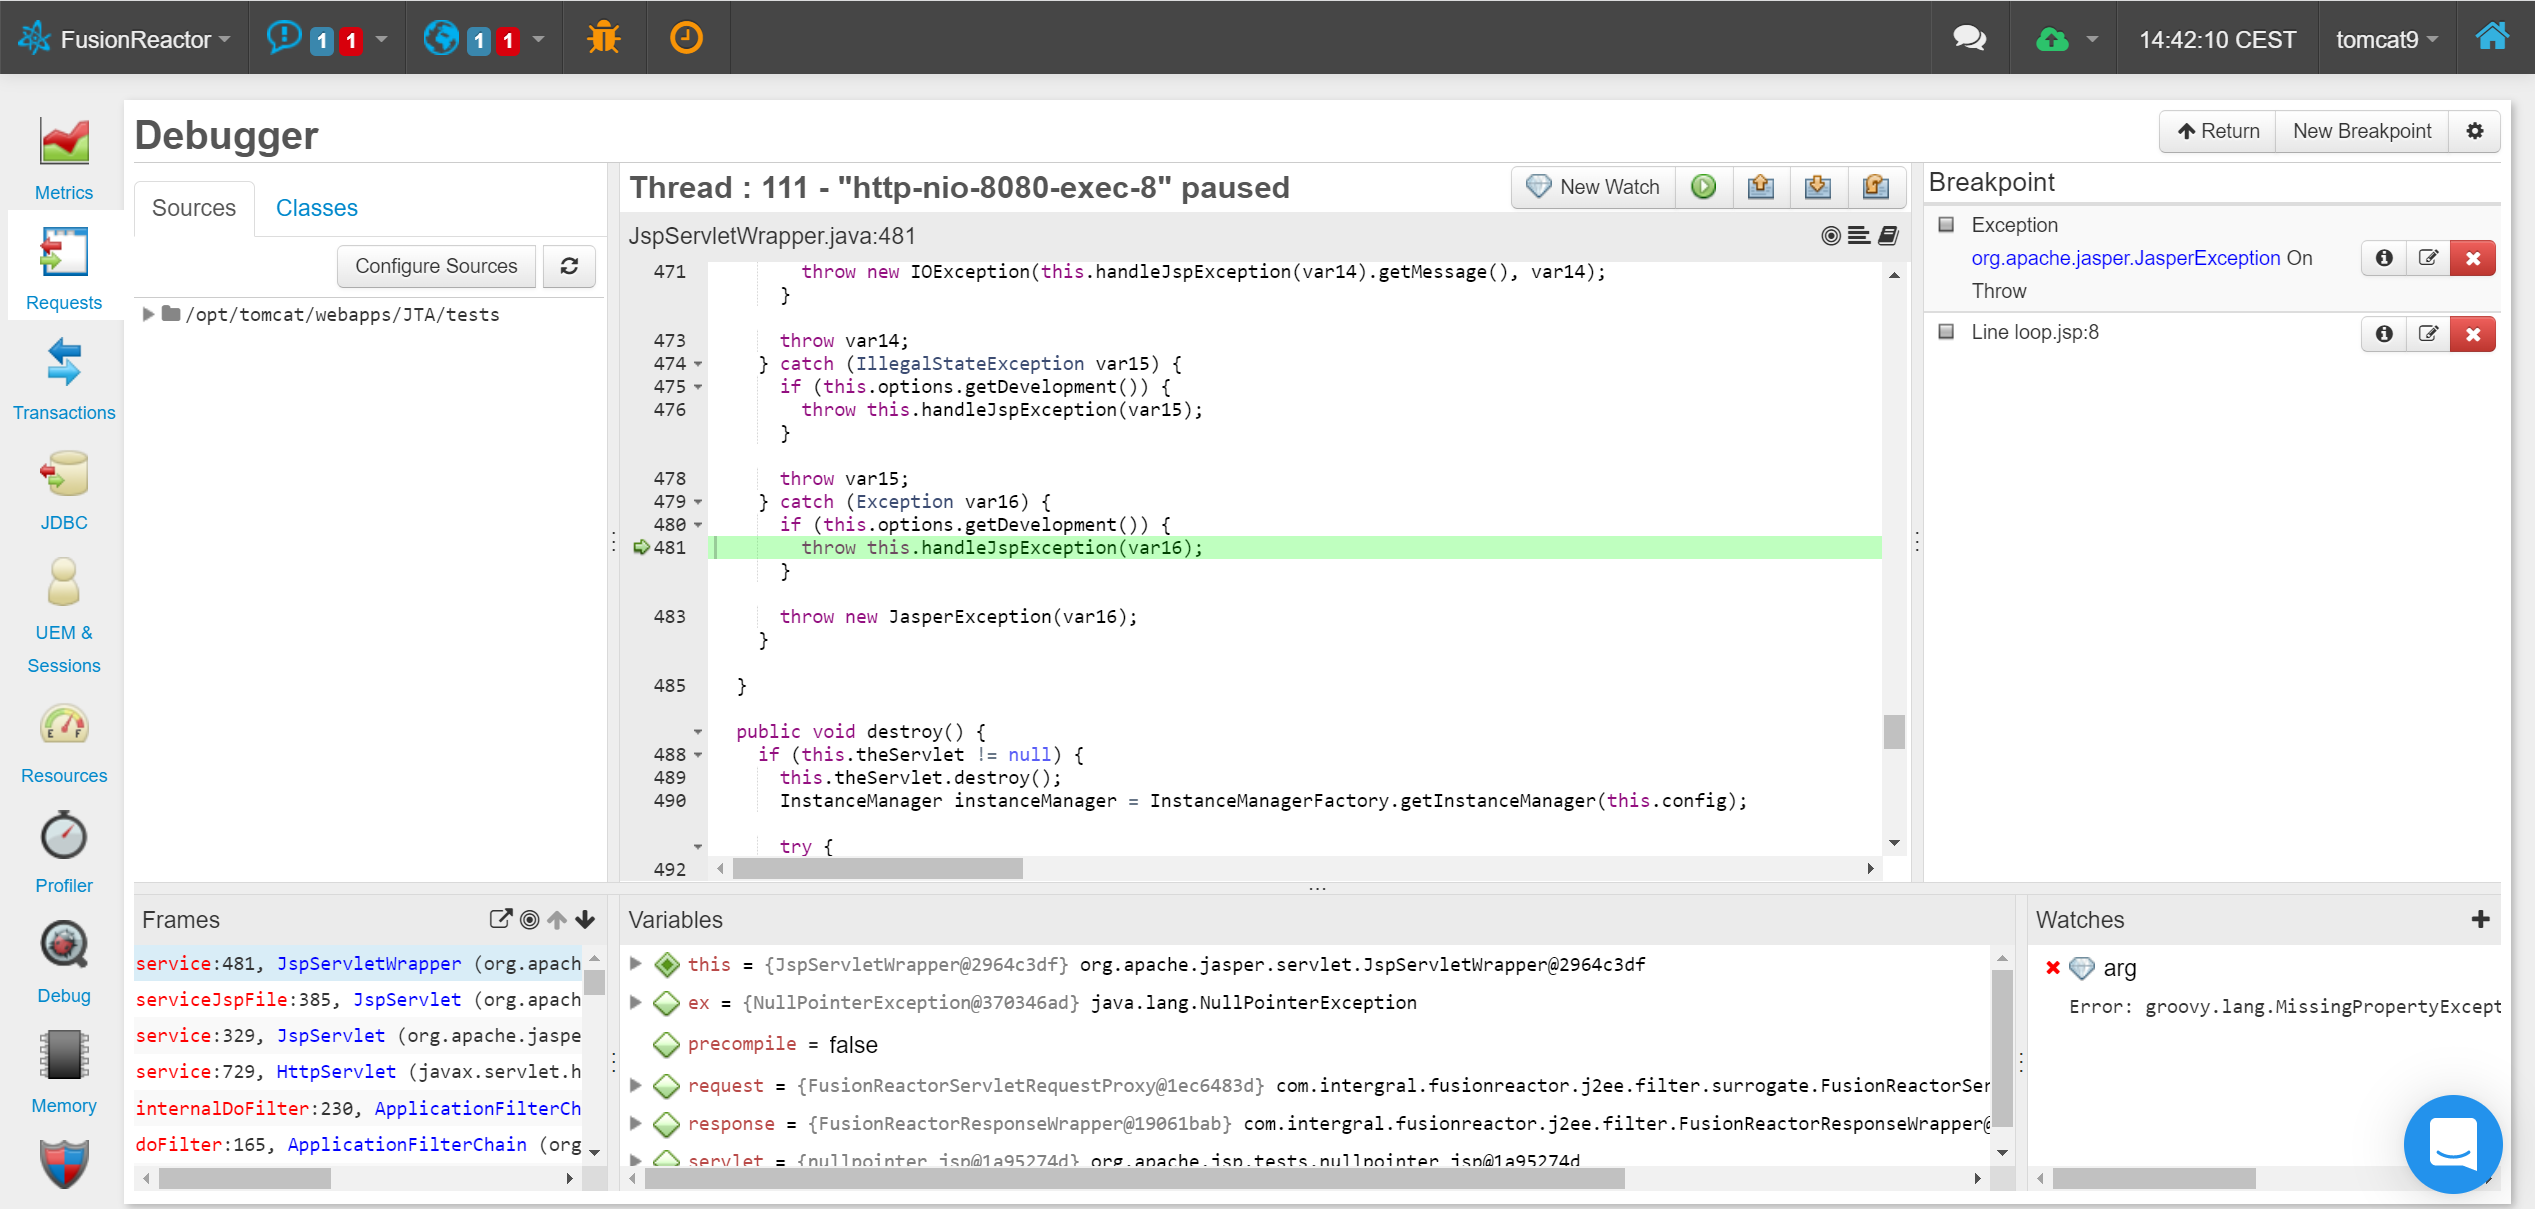
This is a full implementation of a step debugger, which allows step in, step out and step over. It’s also possible to set watches and even modify a variable
Notifications
With JProfiler alternative FusionReactor your application is constantly monitored without you being involved. If something happens with your application, you will get an email with the root cause. Later on, you can check yourself whether it’s something critical or not
Persistence
The main problem with JProfiler is that you have to start recording the data manually. For example, when you open the Exceptions tab, you won’t see anything unless you press the recording button.
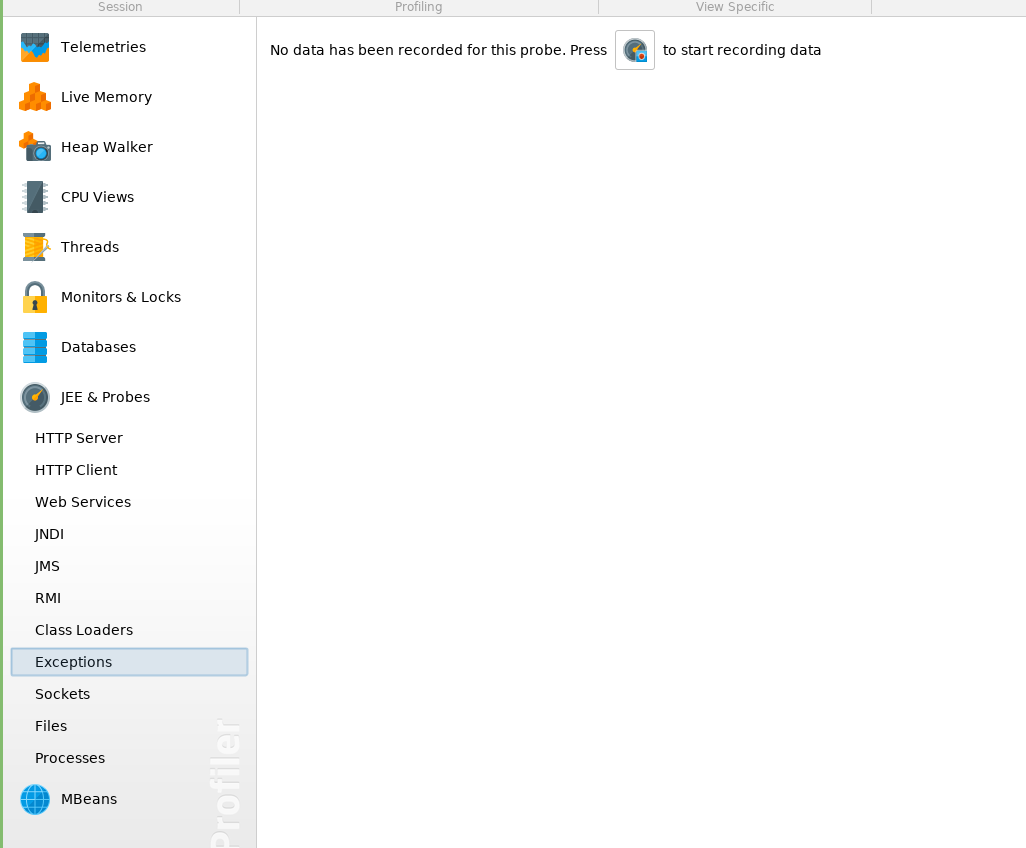
It means that in JProfiler, the errors that happened before recording are missed. However, FusionReactor eliminates this problem by constantly monitoring your app.
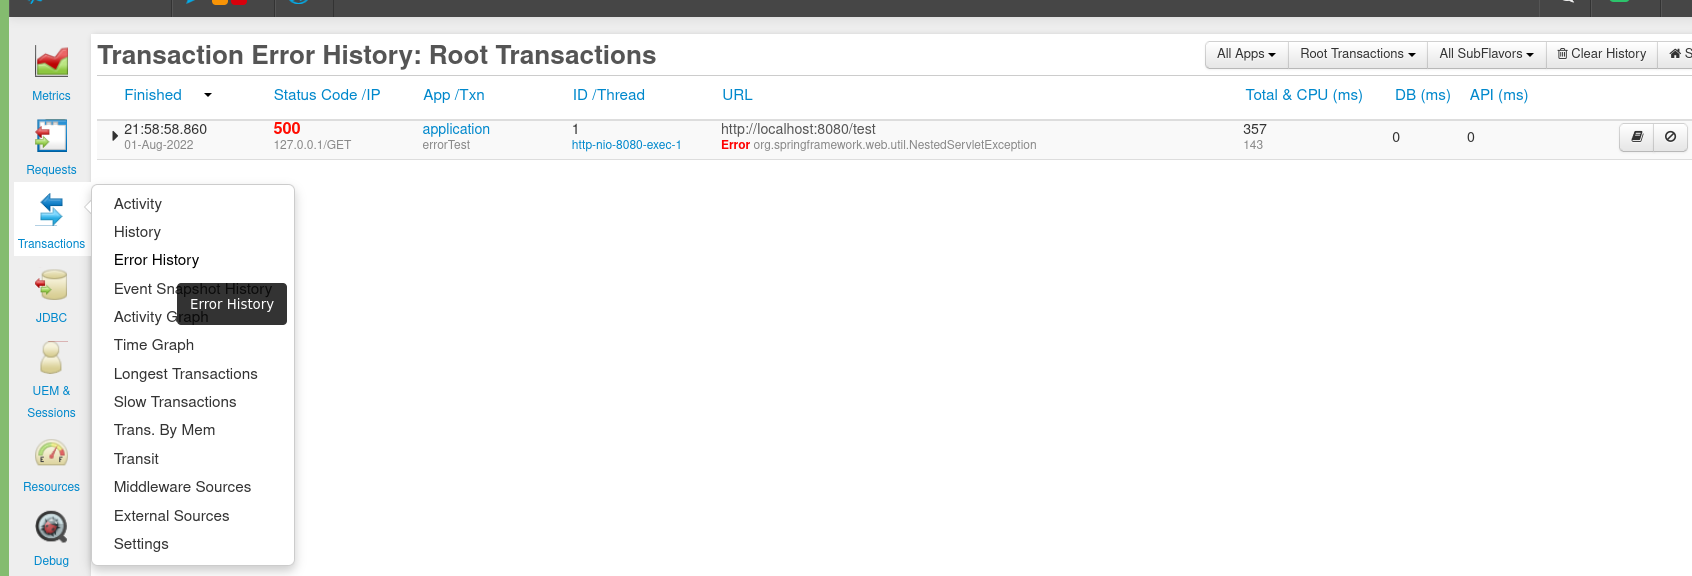
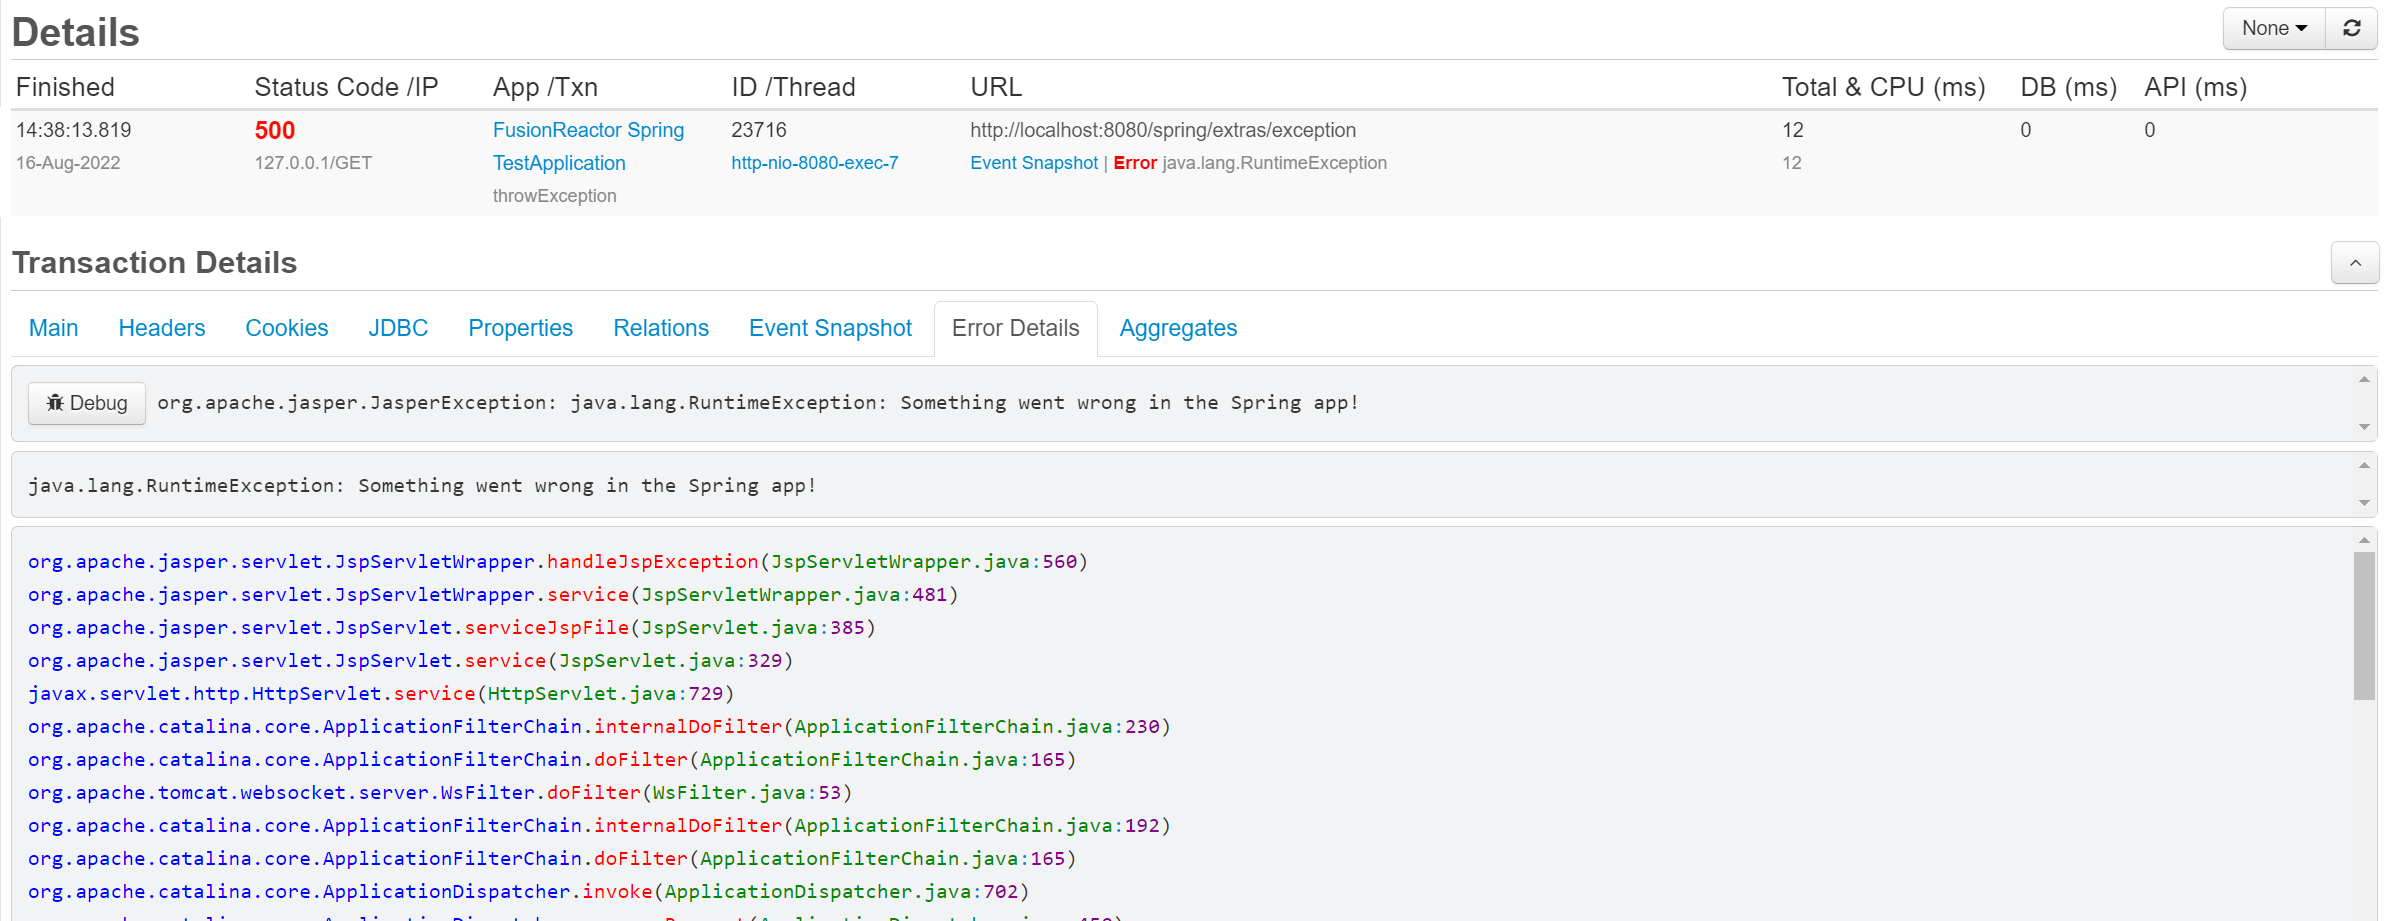
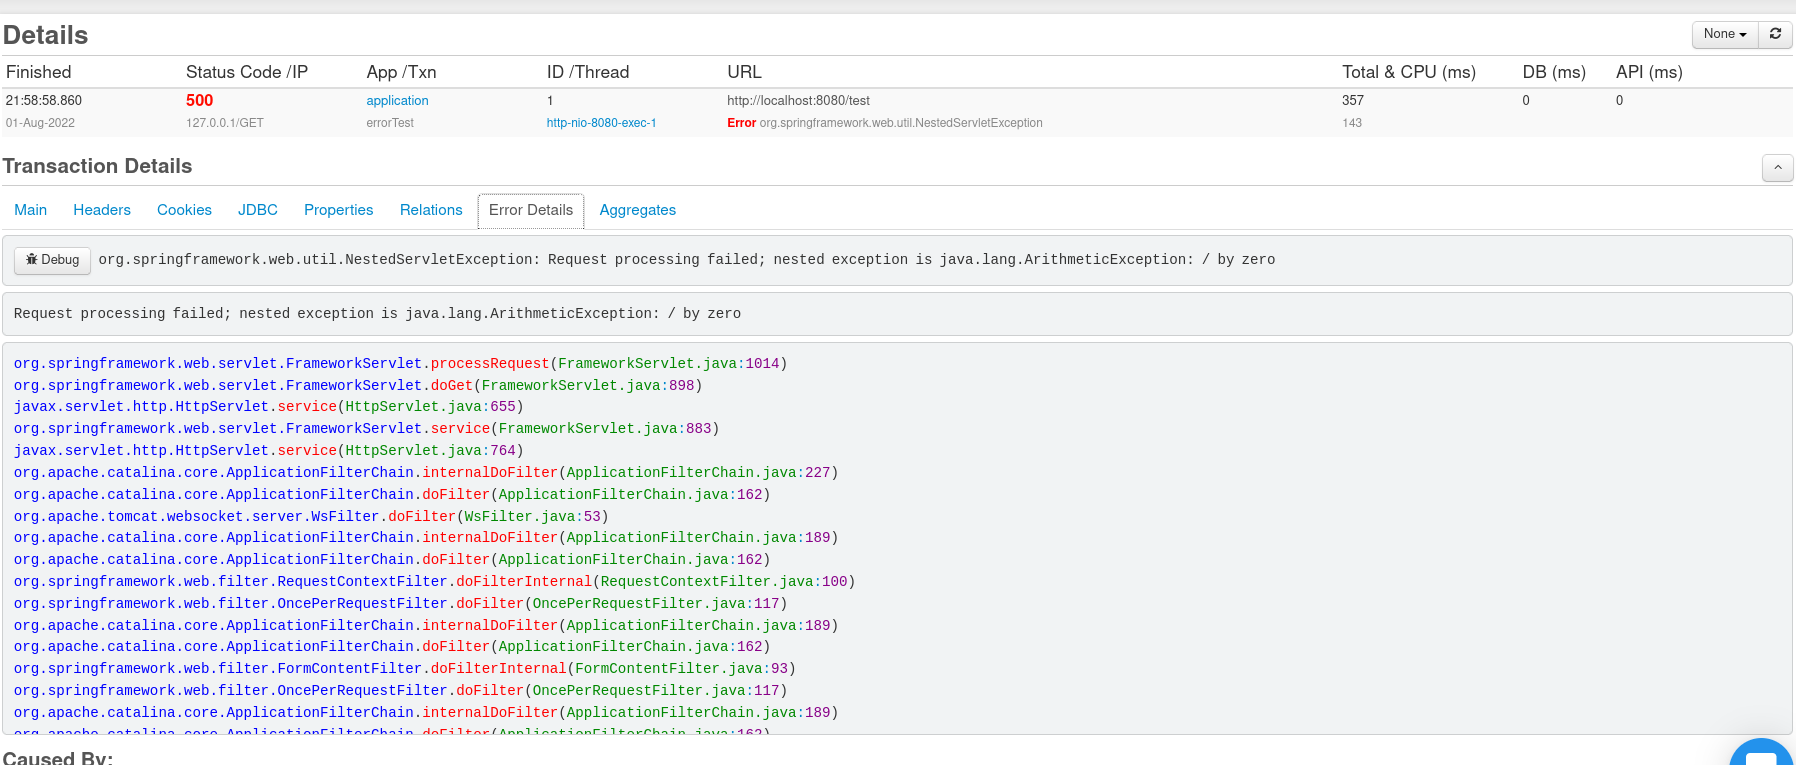
In FusionReactor, all the exceptions can be seen in the Error History tab
Once you found an appropriate exception, you can click on Event Snapshot to look at the root cause with the information attached (HTTP params of the request, JDBC queries, etc). You can also attach the debugger to the root cause right away by pressing the Debug button.
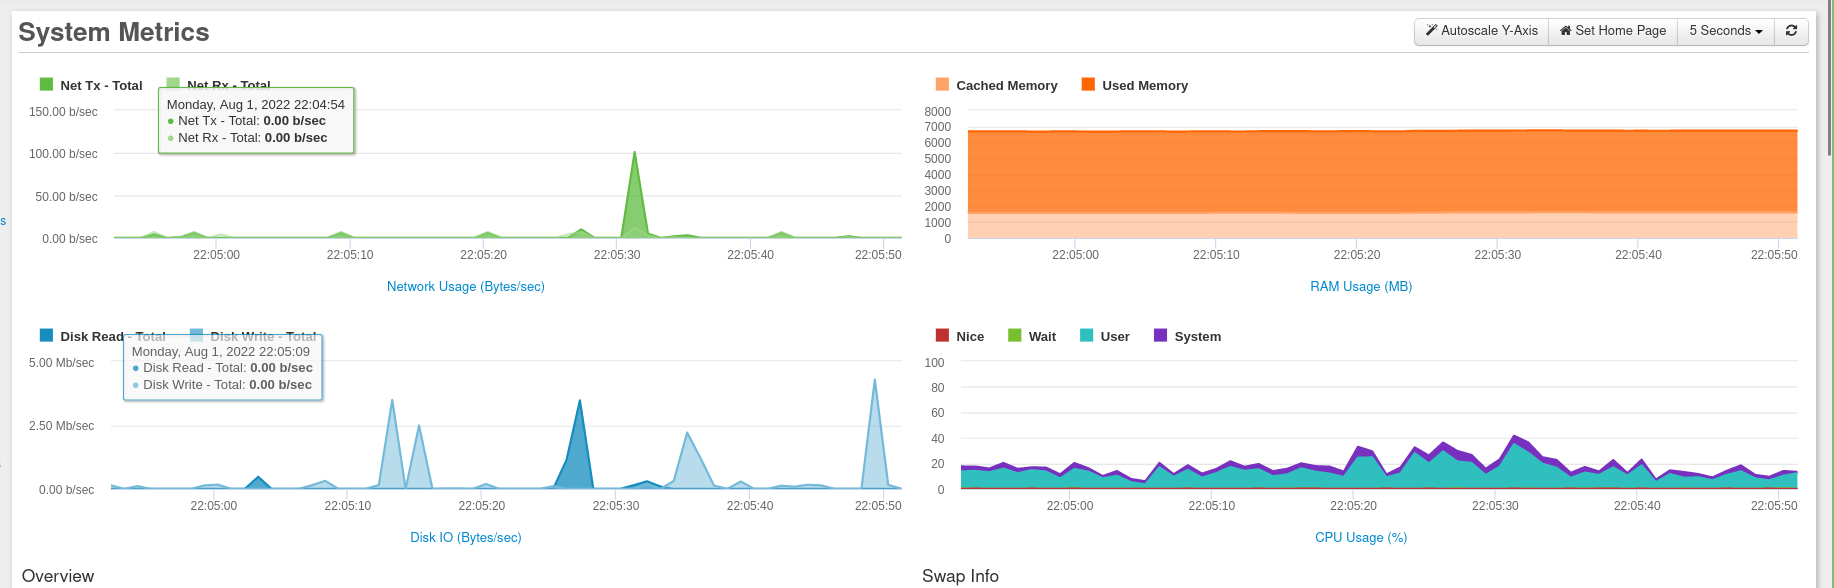
System metrics in FusionReactor
Apart from the Java process, you might be interested in how the underlying server is doing. FusionReactor shows you System Metrics so you can keep track of everything you want without the terminal and CLI applications.
Pricing
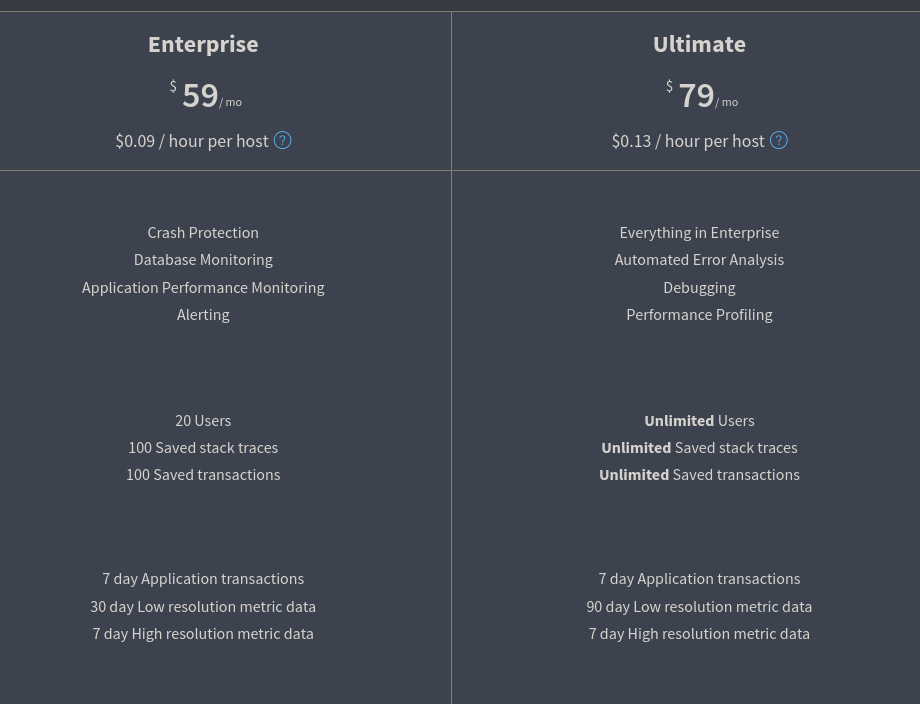
Finally, the price can make a big difference when choosing which Profiling product you need. In terms of JProfiler, the Floating package (which allows many developers to use the profiler) costs $2199; however, if you want to support and upgrade, the package will cost you $3078. After one year, each new upgrade will cost you $799. With FusionReactor, the profiling capability is available in the Ultimate Edition if you want to use FusionReactor in a production environment. However, they also provide a Developer Edition, which costs $228 for an annual subscription. Given the additional capability FusionReactor provides and the lower price, it can offer a dramatic cost saving. The developer edition is licensed per seat, which can also be a great advantage if you have a target server where testing is being done. In this case, all of the developers could utilize FusionReactor and you only need a single license for your test server.
Here are the details on how these price packages differ from each other (remember you get full customer support in both packages)
Is FusionReactor an excellent alternative to JProfiler?
Both tools described in this blog are amazing and dominant in the Java World. Both of them give you low-cost production-level profiling. However, with a broader range of features and cheaper prices, we highly recommend you take a look at FusionReactor. If you are interested, please book a demo with us or just download a trial.
When it comes to Jprofiler vs FusionReactor see how customers score the products in G2.com reviews.