Comparing Java VisualVM with jvisual alternative FusionReactor
Looking for an alternative to Java Visualvm or a jvisualvm alternative, as it is often referred to? JVisual alternative FusionReactor gives you everything you’d expect plus a lot more on top. This article compares both tools to decide which will work best for your use cases.
Java profiling
Profiling in general, is a hard task. Generally, profiling is used to identify which parts of a program should be optimized to increase its speed. Luckily, the awesome ecosystem of JVM makes it much easier for regular developers. But first, you need to answer the simple question. What kind of monitoring or profiling do you need for your application? If you want to know how much time the Garbage collector takes to clean up dead objects? or which class name eats all of the available heap space? If you answer yes to all, then Java VisualVM (jvisualvm) and FusionReactor are good starting points.
Another consideration is which environment you are interested in – development or production – in this case, I’m interested in both.
How do these Java Visualvm alternatives work under the hood?
The curious reader might ask, how do these tools work under the hood? How does jvisualvm alternative FusionReactor collect the metrics of your running java process? The answer is a Java agent.
What are Java agents?
Java agents are a special type of class that, by using the Java Instrumentation API, can intercept applications running on the JVM, modifying their bytecode. The dynamic nature of Java makes it easy to add these interceptors on the fly or specify an agent as a command-line argument to your application. Take a closer look at the FusionReactor setup guide you will see that it requires you to specify an agent:
java -javaagent:/home/strogiyotec/Java/fusion/simple-spring-boot-app.jar -agentpath:/libfrjvmti_x64.so -jar application.jar
FusionReactor vs VisualVM (jvisualvm)
Before we start, let’s have a brief introduction to VisualVM. According to Oracle:
Java VisualVM (jVisualVM) is a visual tool integrating command-line JDK tools and lightweight profiling capabilities? Designed for both development and production time use.
It’s distributed as a part of JDK and installed on the host machine. Now let’s walk through a step-by-step comparison of both technologies.
GUI vs. Web
Both JVisualvm alternative FusionReactor and Java VisualVM are graphical interfaces to view stats of remote and local Java applications in real-time. VisualVM is a Java-based desktop application, whereas FusionReactor offers a web interface. JVisualVM also requires the client to have a JDK installed – FusionReactor does not have this requirement. Ideally, it should be easy to profile live applications in response to incident reports (more on performance impact later). FusionReactor offers a web interface so anyone with a web browser can profile an application.
When looking at the user experience, quick response to production-level problems is essential. When the dev team is not available, non-technical people will be unable (without proper training) to install JDK, launch VisualVM, connect to the production environment and take a snapshot of the issue. With FusionReactor, as long as the agent is installed, it is just a matter of opening a new tab in the browser that everyone with an internet connection can do.
Default page
To compare both tools, we have prepared a simple spring-boot project packaged as a single fat jar. The application is running on port 8080 and has a single GET endpoint /hello that inserts a random row into the in-memory H2 database. The source code is available here Check out the GitHub repo on how to build and run the project). Now when the project is up and running let’s open VisualVM (typing jvisualvm in the terminal should be enough if you have JDK installed).
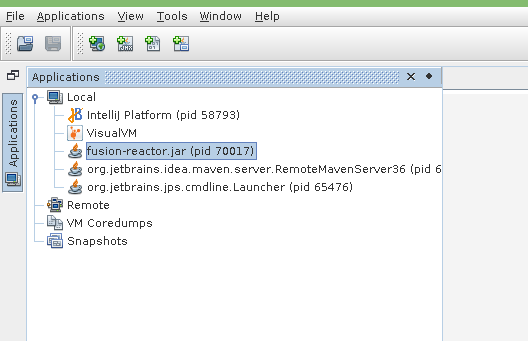
From this list choose your application by PID (in this case it’s 70017) The image above shows how the user interfaces in VisualVM will look for OpenJDK 11.
In the default Overview tab, you can see
- JVM flags that were passed to the Java process (in this case no flags)
- The JVM version and vendor
- Other system properties
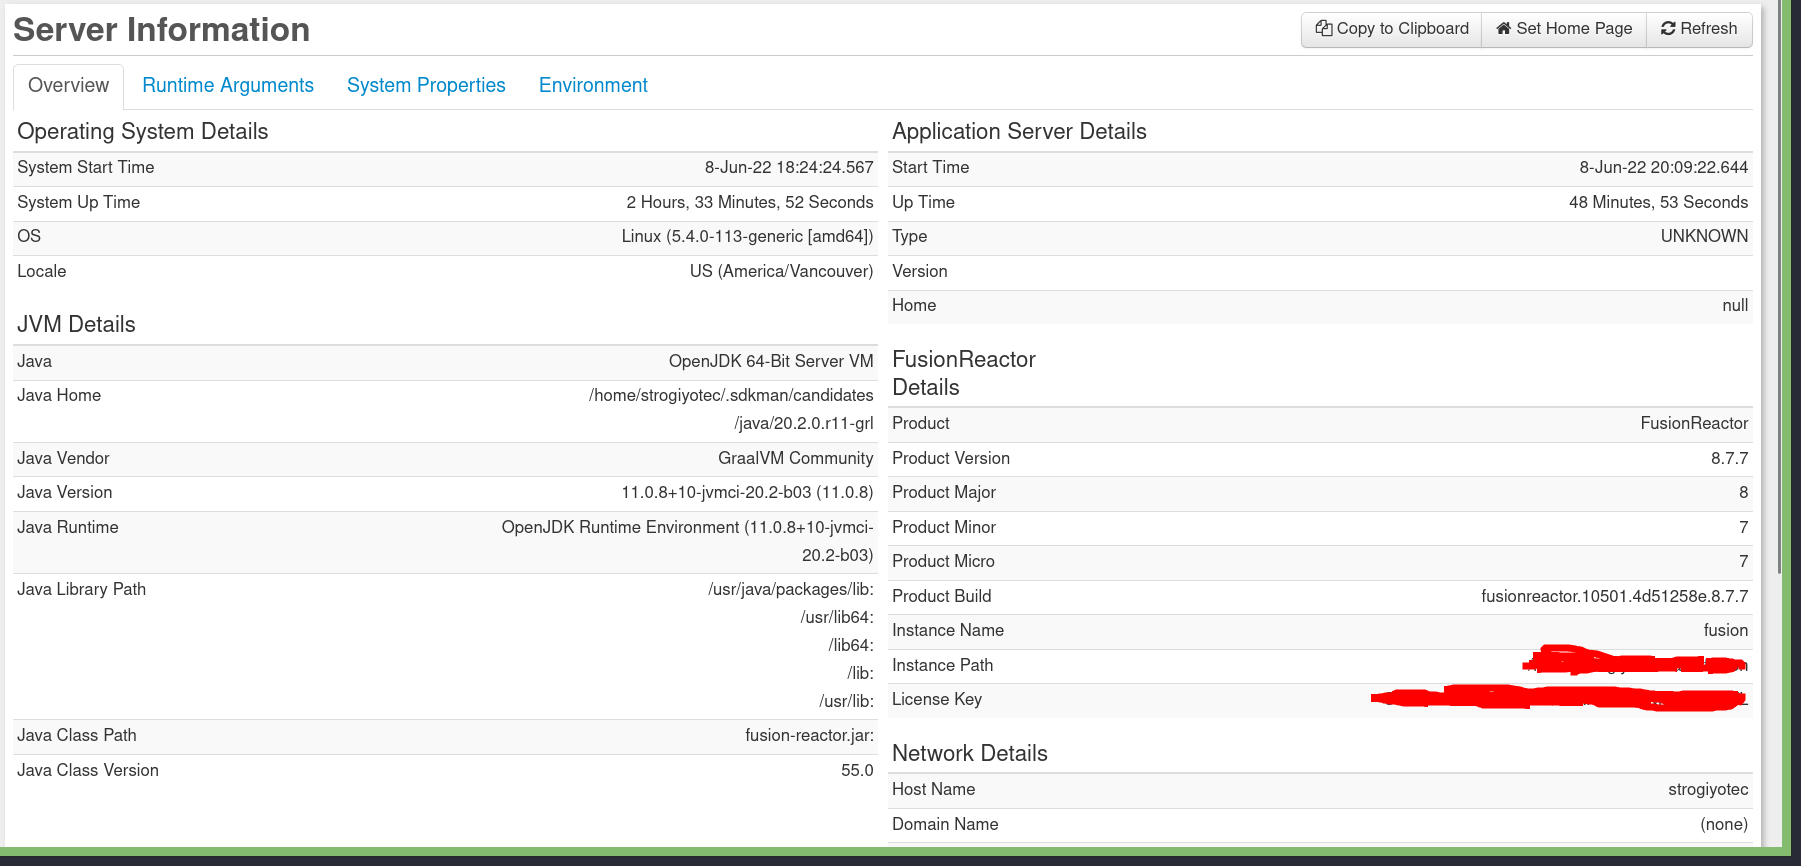
What about the Jvisual alternative FusionReactor?
First, you need to run the jar file with a Java agent attached. The command will look like this:
java -javaagent:/fusionreactor.jar=address=8088 -agentpath:/libfrjvmti_x64.so \
-Dfrlicense=LICENSE_NUMBER \
-Dfradminpassword=COMPICATED_PASSWORD \
-jar simple-spring-boot-app.jar
Once the app is deployed, open the admin page in the browser http://localhost:8088 (the password will be the one specified by the Dfradminpassword parameter). The default home page shows a combination of real-time metrics – web transaction throughput, errors, JDBC transaction throughput, and the main resources – memory and CPU. As well as this, FusionReactor also provides additional info, such as server uptime, request, JDBC and error counts. Here is the default home page interface.
FusionReactor is a complete monitoring tool so it will offer a lot more capability. Rather than covering the JVM process itself, FusionReactor also gives a whole overview of the underlying machine that hosts the JVM.

Main JVM metrics
In this section, we are going to compare how both tools deal with JVM metrics such as Garbage collection, memory monitoring, Threads activity, and Just in time compilation (JIT).
Garbage Collector (GC)
Both VisualVM and jvisual alternative FusionReactor support the insides of the garbage collector used by the application. The screen below shows what the GC tab looks like in Jvisualvm:
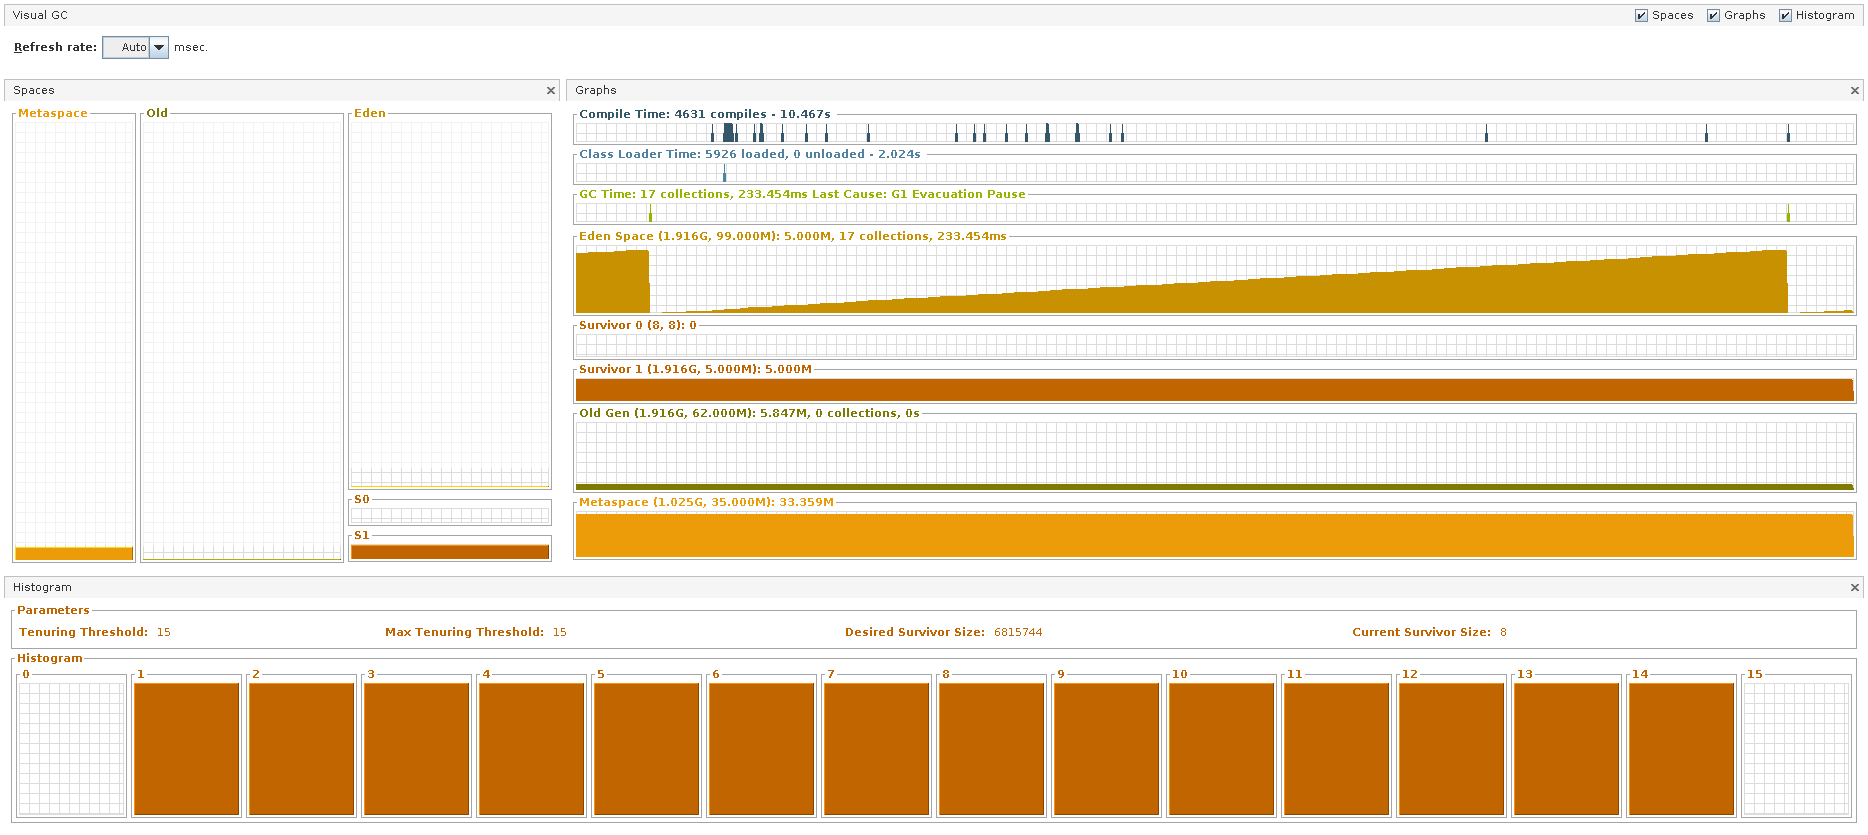
You can see the main GC statistics here such as
- Number of collections
- Eden, Survivor, Old and Metaspace sizes.
The data refresh rate can be adjusted with a dropdown in the top left corner. To tune garbage collection settings for performance, we need to know which garbage collector the application is using. In this interface, it’s hard to tell which type of garbage collector it is. There are many GC types the JDK ships and defaults vary between versions and vendors. For our demo application, VisualVM shows a small green label called G1 Evaluation Pause suggesting that the Garbage First (G1) collector is being used.
FusionReactor interface for GC
Let’s take a look at the FusionReactor interface for GC. First, go to the Resources tab and open the Garbage collection section.
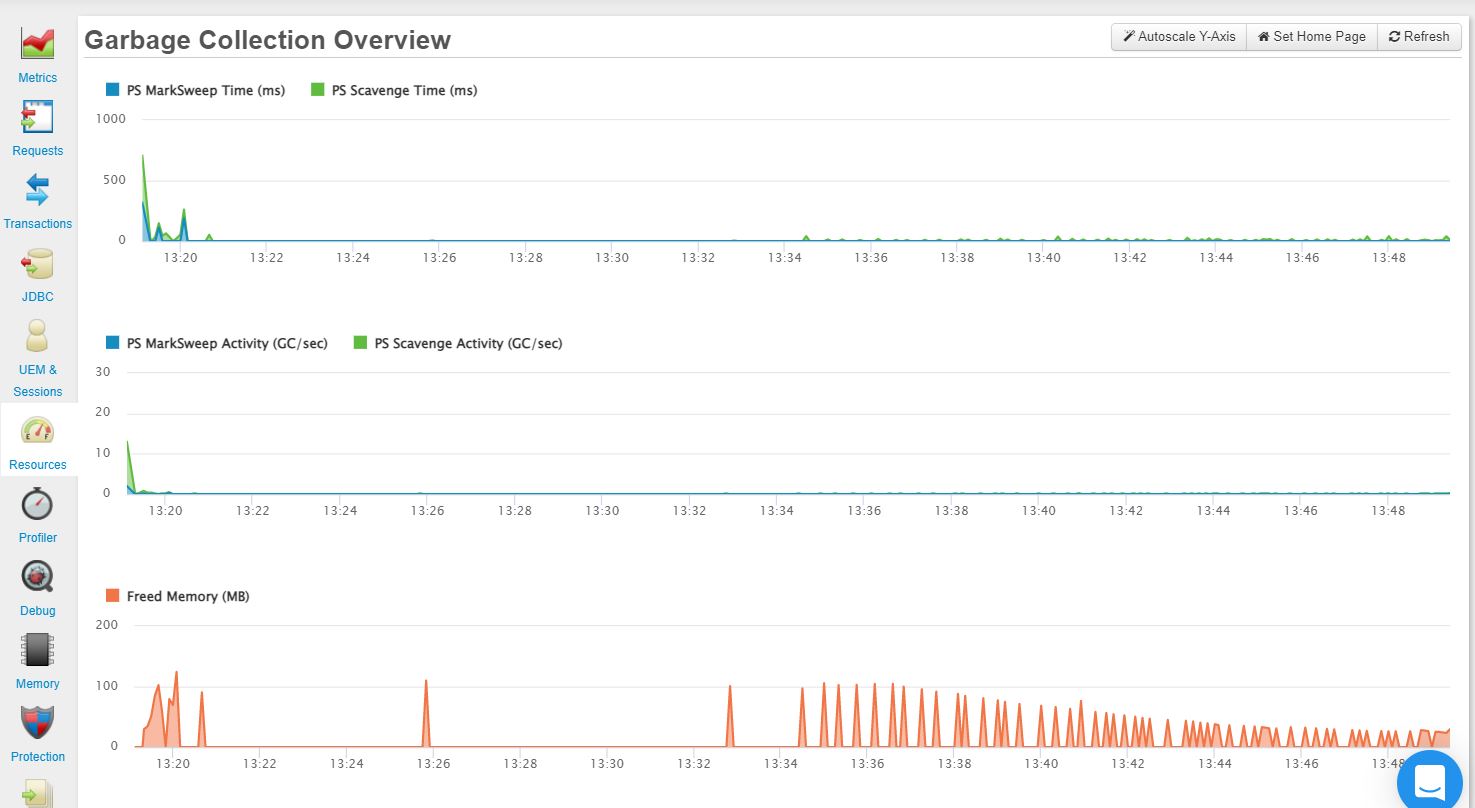
With simpler screens it is a bit easier to tell which collector is used: The chart labels suggest that the G1 collector is being used. FusionReactor features many of the charts from Java VisualVM so new users coming from VisualVM won’t have any trouble understanding the UI. In addition to that FusionReactor brings a lot more features
- it automatically records and persists garbage collection logs. With VisualVM you will have to collect these logs manually.
- How much time does each GC generation take (Old and Young)
- The number of garbage collections per second (for both generations)
- The statistics on Freed memory after GC
Memory monitoring
Memory monitoring with Java VisualVM (jvisualvm)
Next, let’s compare Memory monitoring starting with the JVisualVM
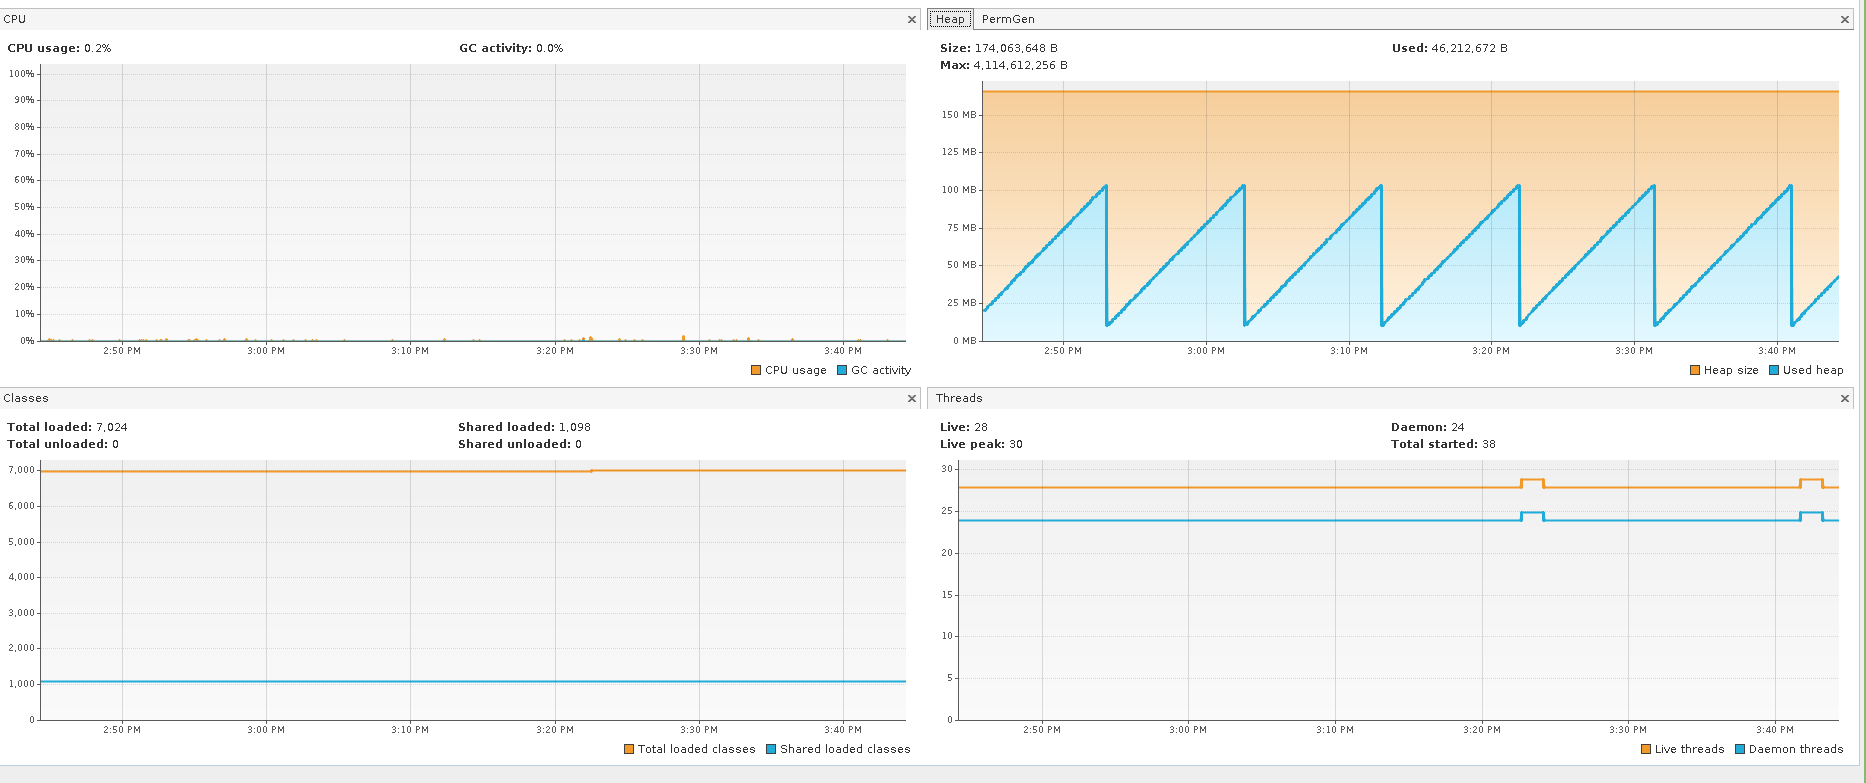
As you can see, VisualVM doesn’t give you a lot of insides on application memory except for the total Heap allocation. Heap is a good metric to start with, but I feel this is not enough to troubleshoot the actual cause of a memory-related issue. Can FusionReactor, a Java Visualvm alternative do any better?
Memory monitoring with FusionReactor
How is FusionReactor different? First, it has a lot more tabs for memory monitoring under the Resources tab. The default page is the Memory overview:
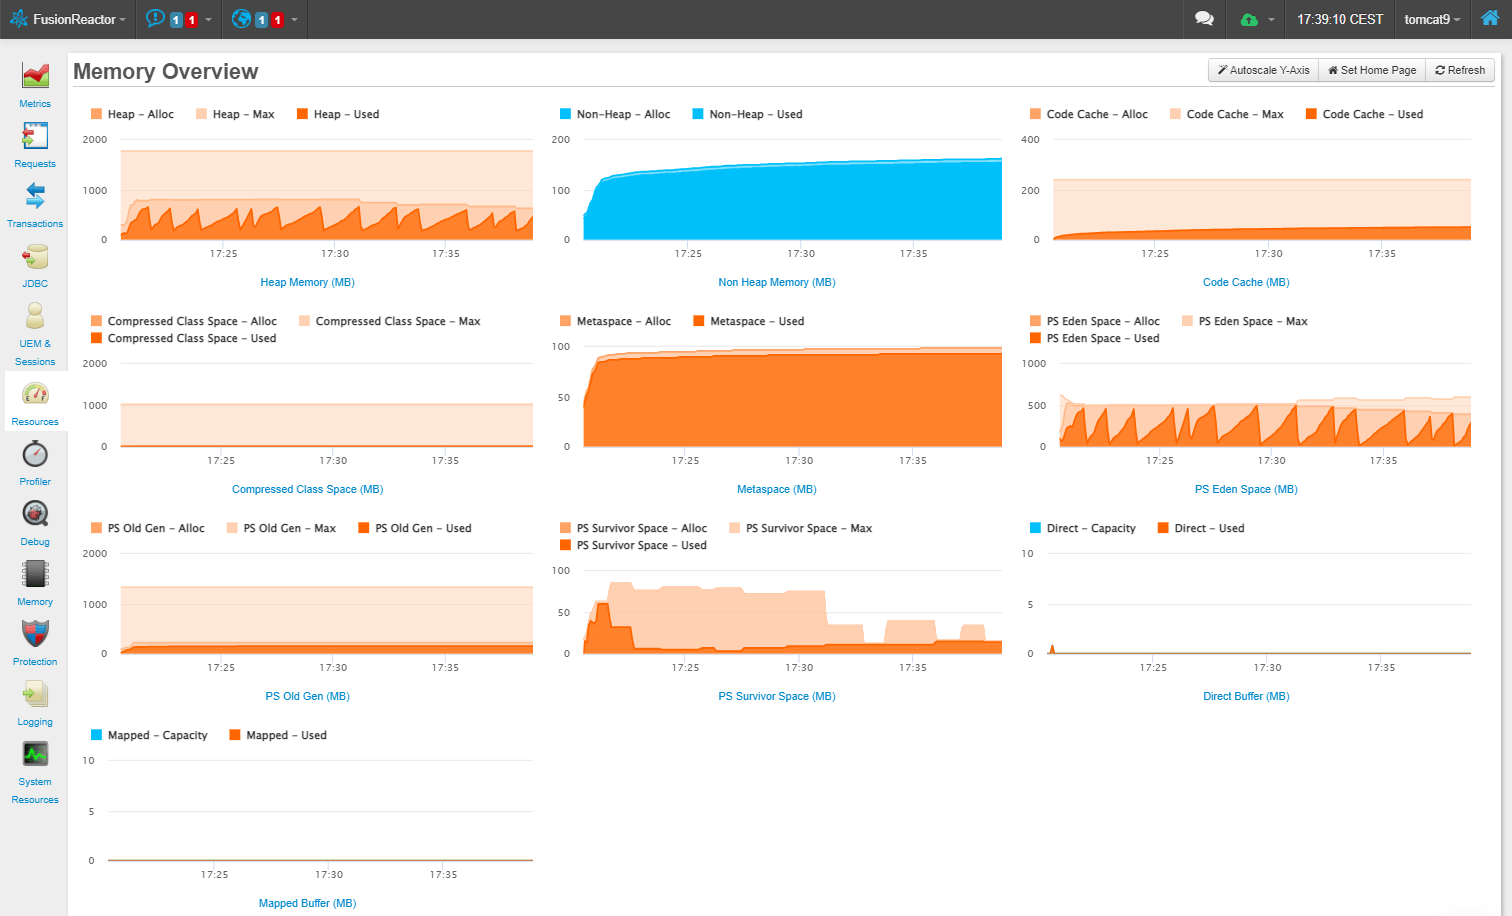
FusionReactor will display all of the memory spaces it detects, which depends on the version of Java you’re running:
- Heap allocation
- Non-Heap allocation
- CodeHeap (profiled and non-profiled methods)
- Compressed Class Space
- FusionReactor also shows the amount of memory that each generation takes
- Eden Space
- Old Space
- Survivor Space
As with garbage collection, all metrics are recorded and persisted for future viewing. Most Java servers are running on top of servlet containers such as Tomcat or Jetty, if you need to see how many buffers are used to store HTTP requests then the Buffer Pools tab will be your way to go (VisualVM doesn’t support it natively and so you will have to install a third-party plugin to see it, We come back to this later when we compare plugins system)
JIT
JIT compilation can be a silent performance killer, particularly when the compiler makes wrong assumptions about the code causing it to recompile hot methods again and again wasting CPU cycles. VisualVM doesn’t offer any JIT-related information. FusionReactor’s Resources tab plots JIT compilation time. It can be filtered by specific time periods.
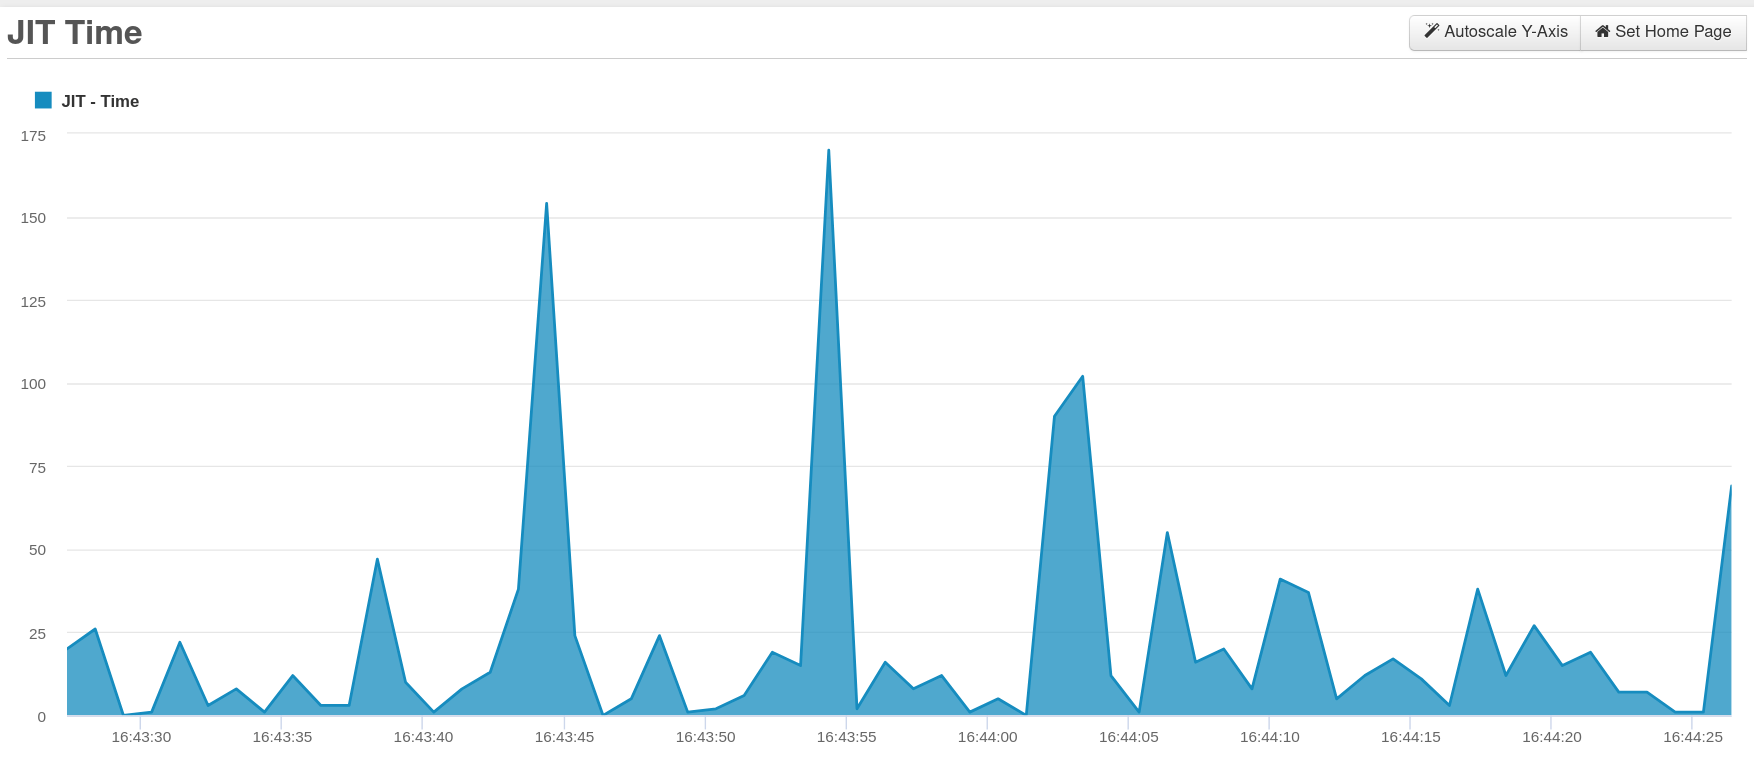
For more JIT-related metrics consider trying JIT watch from AdoptOpenJDK
Threads
When developing a high-performance Java backend it’s essential to understand how many threads will serve user requests and what these threads will actually do. If most of them are stacked in a blocking state there could be a huge I/O bottleneck. Both tools show all the threads in the application with their names and current states (This is shown in the Threads tab in VisualVM and Resources->Threads in FusionReactor).
JavaVisualVM Thread profiling
Let’s start with a VisualVM Thread Profiling
VisualVM plots all the threads into a single page. There you can see threads by name and their current status. One of the biggest disadvantages is that you can’t filter by Thread name, which makes monitoring much harder. So let’s look at what the Java Visualvm alternative can do.
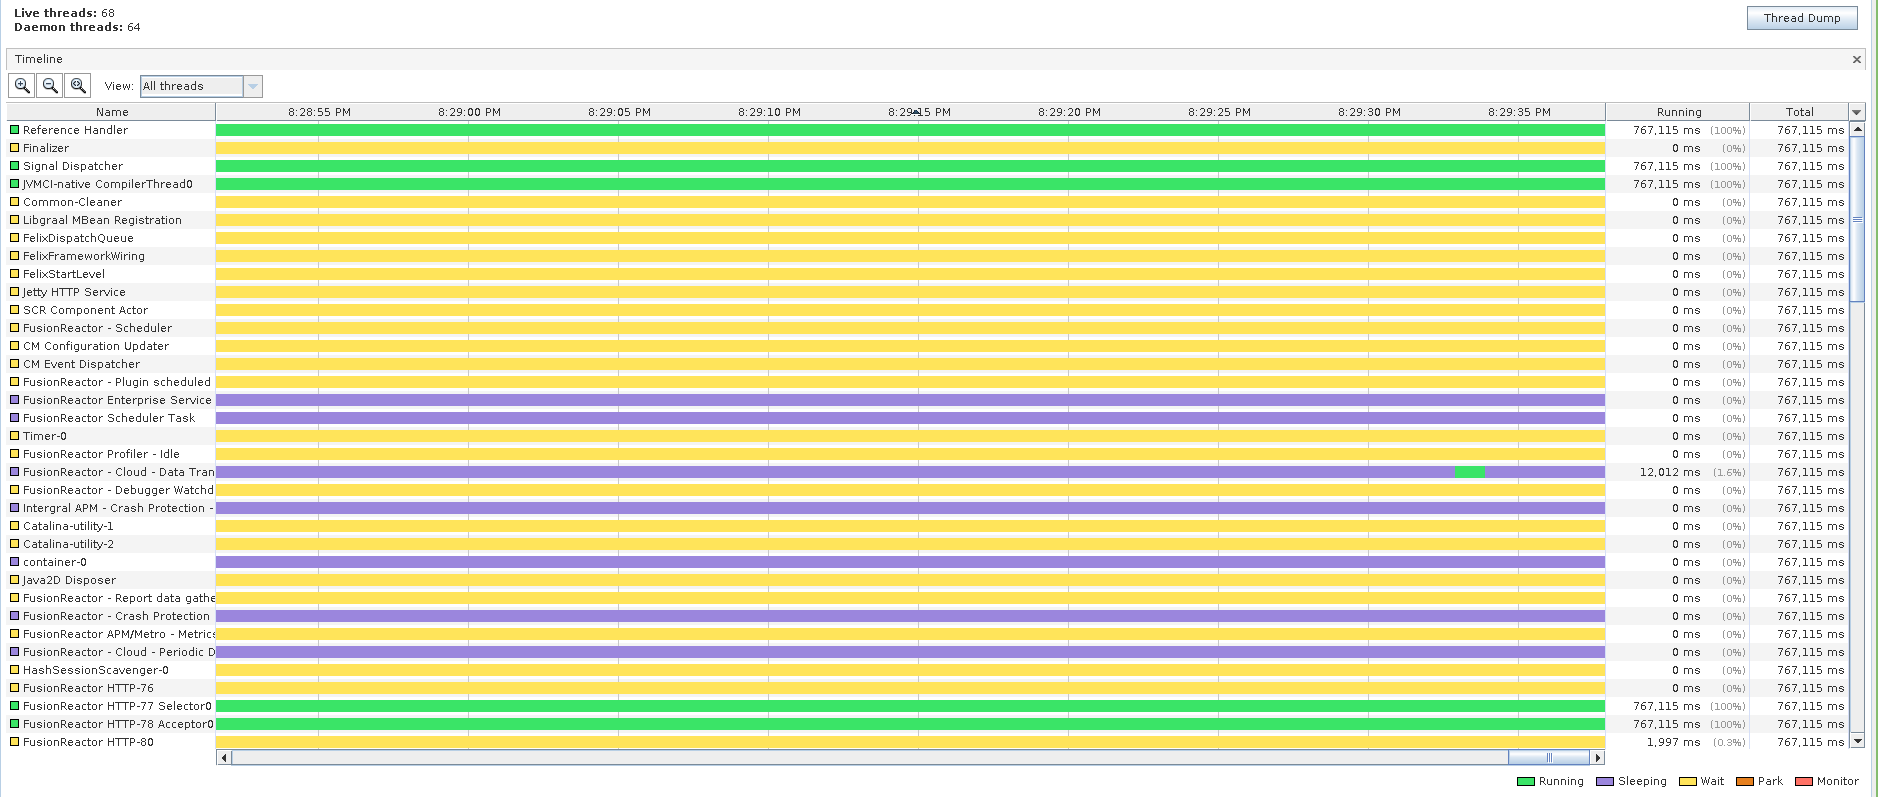
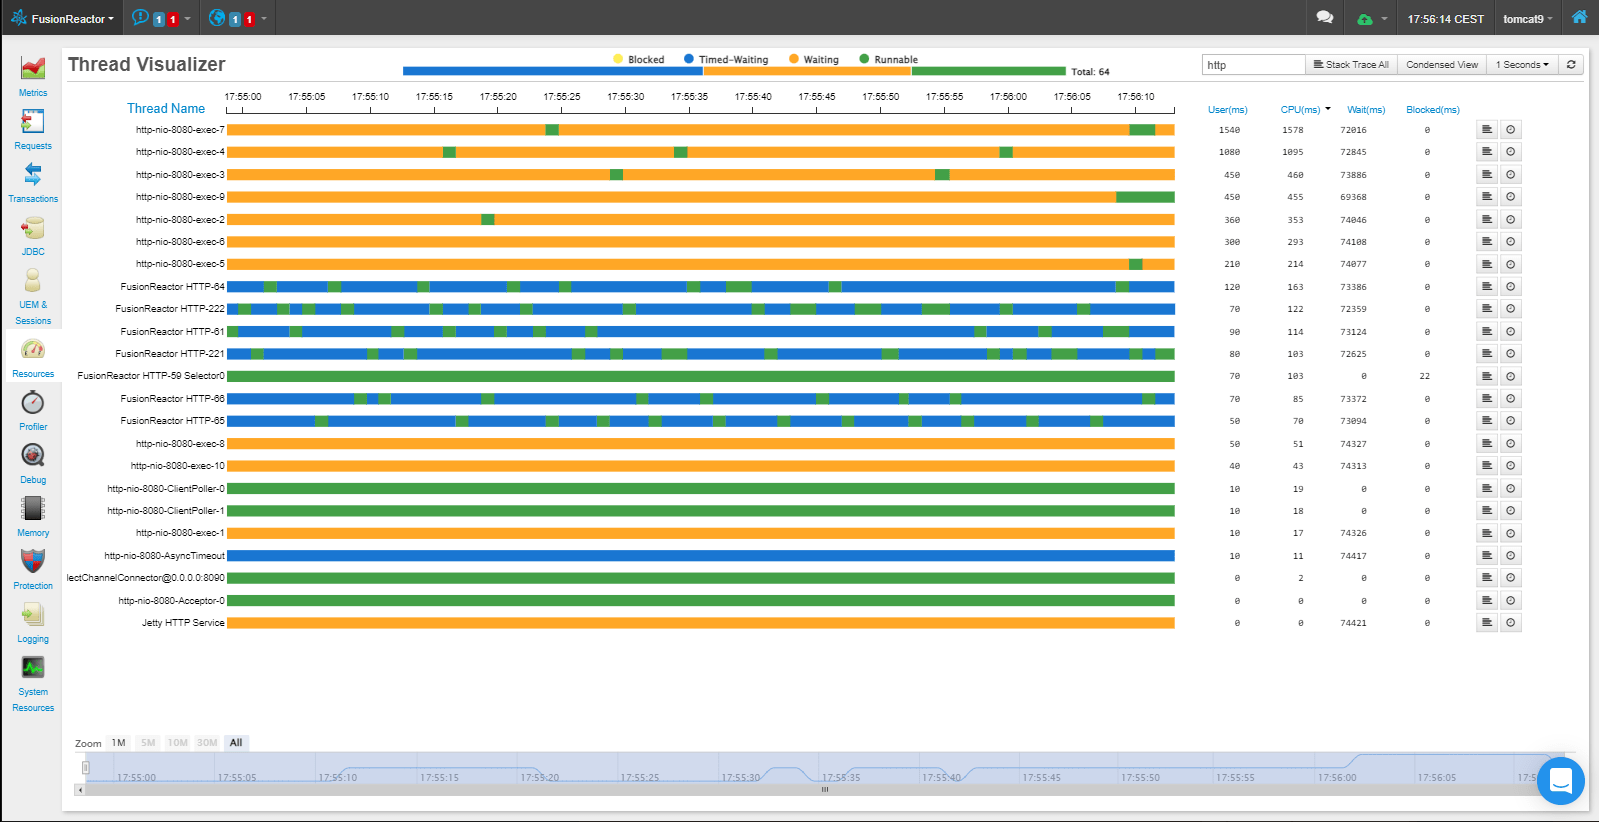
Thread profiling using FusionReactor
FusionReactor includes a number of specific pages to allow you to analyze threads.
It has a very similar representation to Jvisualvm. Although I have some additional useful capabilities here. I can:
- Filter for a specific thread name
- Sort the thread on CPU Used, Wait or Blocked Time
- I can instantly perform a stack trace or activate the profiler for any thread, which is really useful in order to see why something is not performing as it should
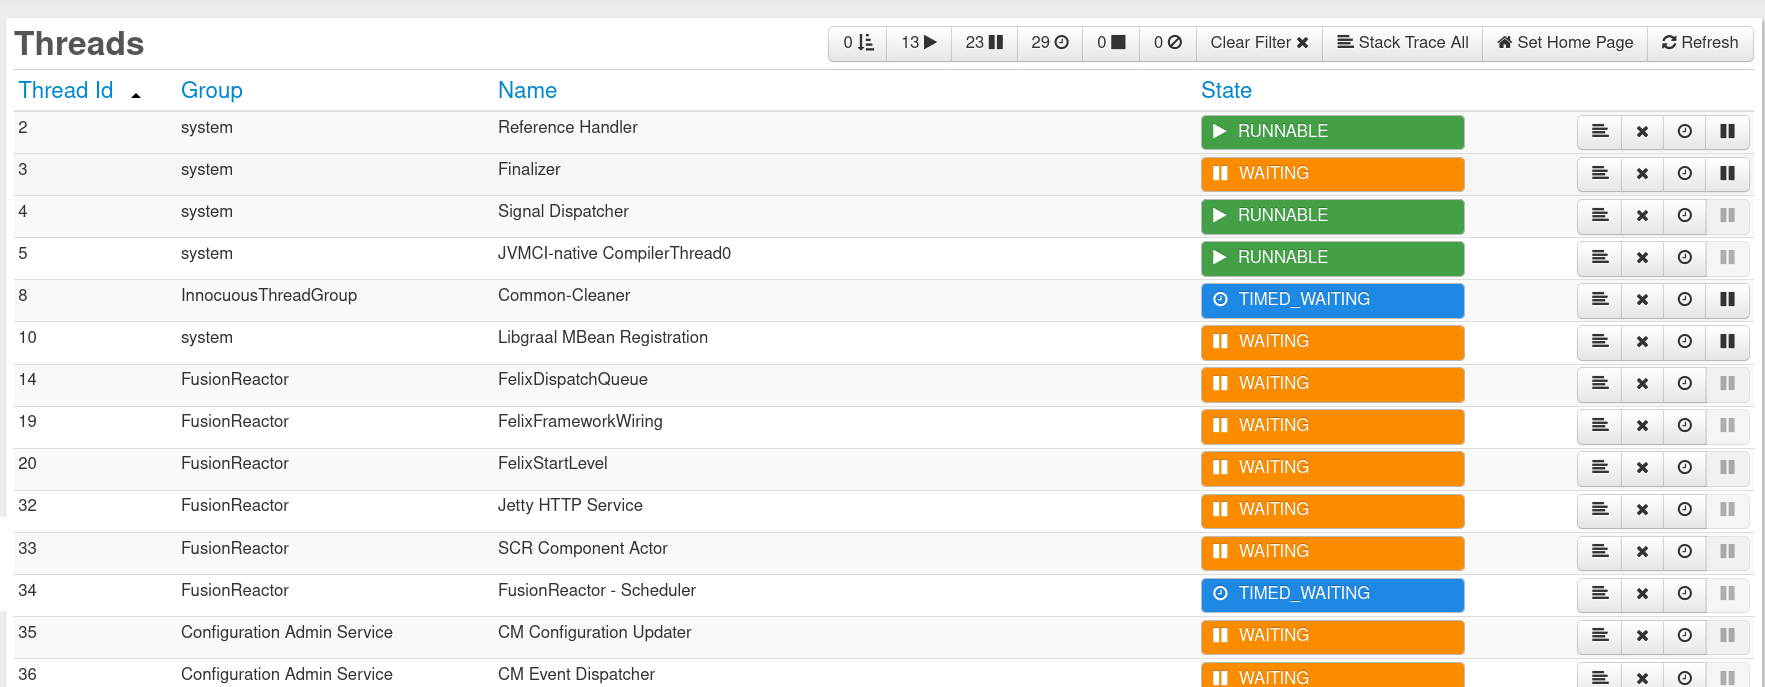
FusionReactor has a few benefits over VisualVM in terms of Threads monitoring.
On this page, you can
- Filter threads by their states (This is useful for debugging I/O problems it can come in handy).
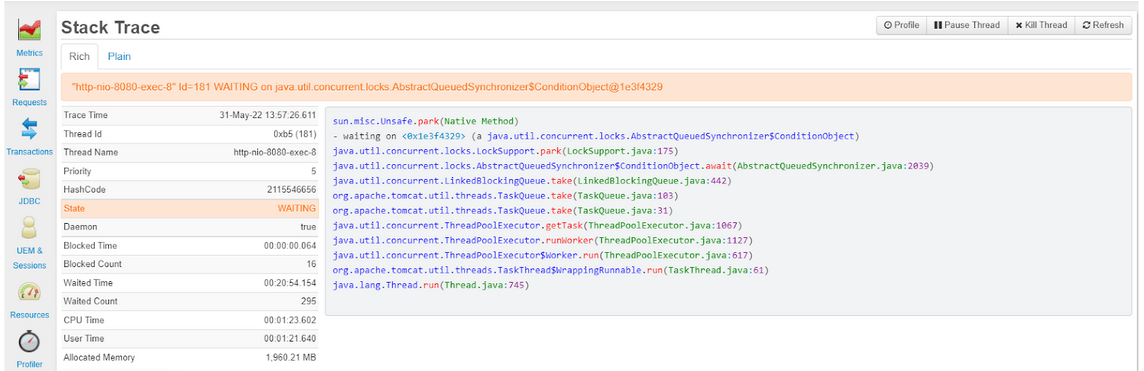
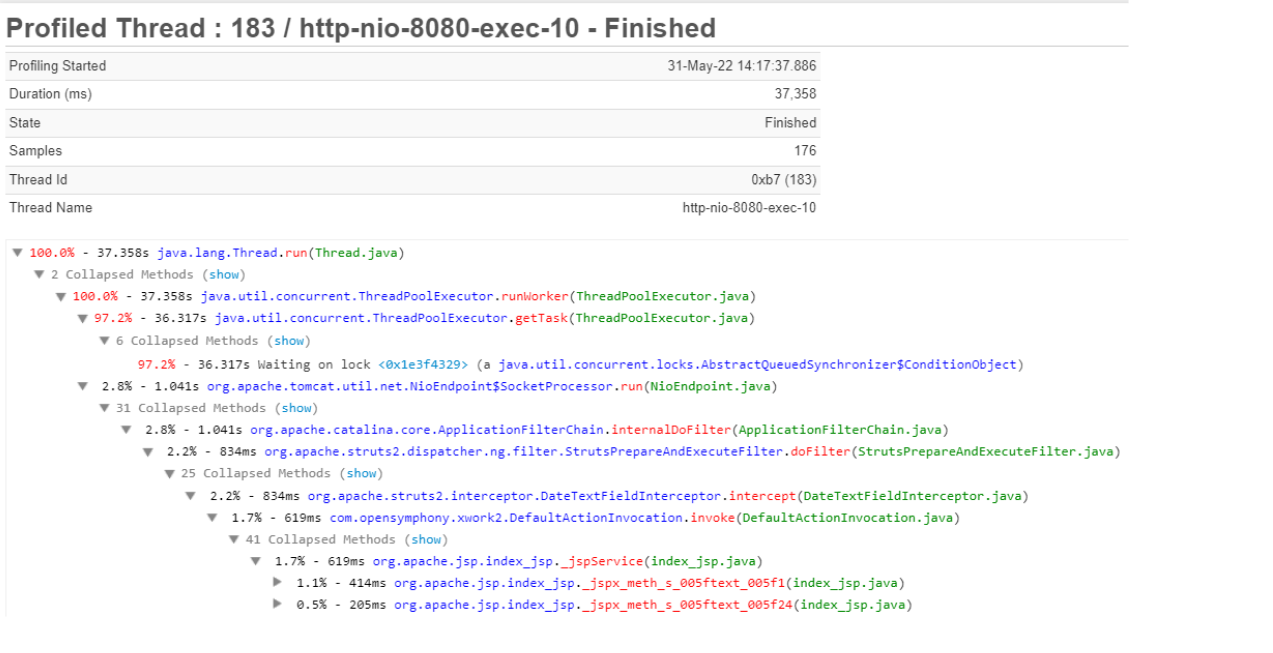
- Profile a specific thread – provides a detailed profile, which analyzes down to method level of the performance and time spent in each method
- Run a stacktrace from a specific thread – which enables you to easily pinpoint why a specific thread is not performing as it should or is in a specific state (for example, this thread is waiting on
takethe method which is blocking) - From the stack trace, you can also see many other details about the thread – name, ID, state, wait time, CPU time, User time, allocated memory etc.
- You can stop any threads
(REMEMBER stopping threads needs careful consideration, for example if the stopped thread was holding a monitor it may cause a deadlock in your application)
JDBC performance profiling
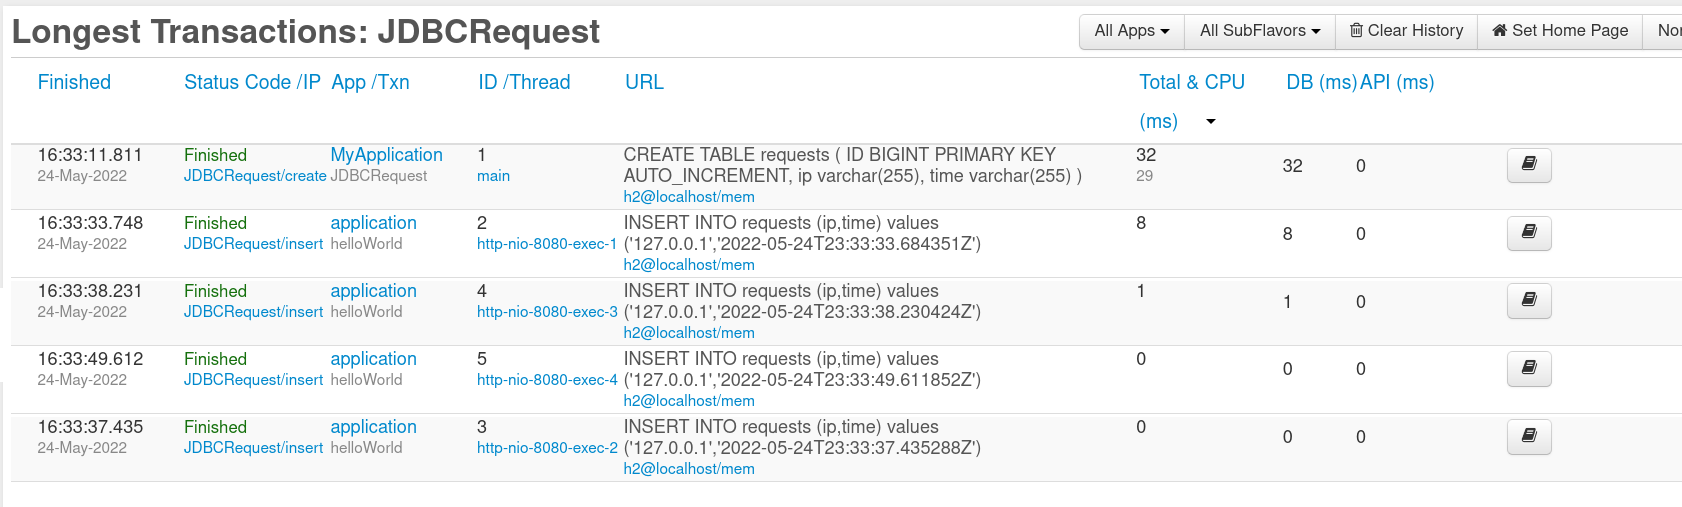
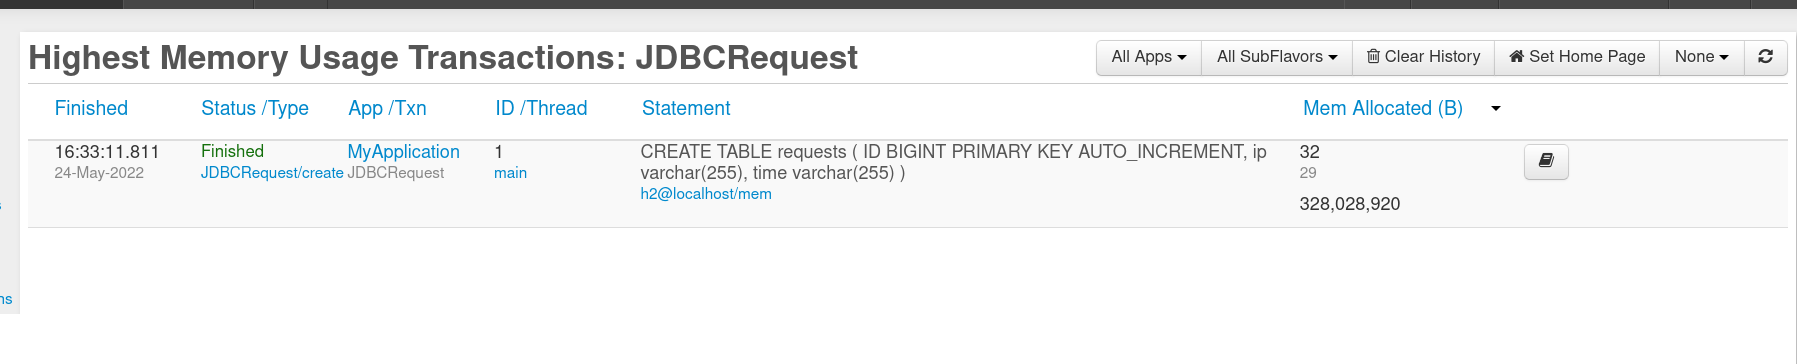
In terms of web development apart from servlet container threads, developers are interested in database performance (using JDBC) to ensure a good user experience. VisualVM has a nice JDBC profiling feature that shows all SQL queries sent to the database. Similarly, FusionReactor offers JDBC profiling with some additions. In the JDBC tab, apart from all SQL queries, users can check the ratio of successful to unsuccessful queries and track SQL exceptions. Also, for most SQL databases because of the way the delete and update queries work, it’s essential to reduce the amount of time a single transaction takes. To monitor transaction time, FusionReactor has tabs to view the longest and slowest transactions respectively.
JDBC performance profiling using FusionReactor
Java developers enjoy the abstraction that the JPA specification brings us. Performing all database operations through an “object relational mapping” library (ORM) can speed up development, reduce mistakes, and decouple business logic from the particular data store. An alternative is to manually write queries and map their results to native data structures, but this can be duplicative, labour intensive, and error-prone. Therefore, it makes sense to abstract away the most common operations. However, without easy introspection into how the ORM maps methods to queries on a per-operation basis, how does one know what the network load will be like in practice? How does one identify low-hanging queries to optimize without seeing the SQL in code? Even with the SQL queries available, how does one measure which ones are actually bottlenecks in production scenarios?
To answer these questions FusionReactor offers the Transaction by Memory tab which shows the total allocated memory per query
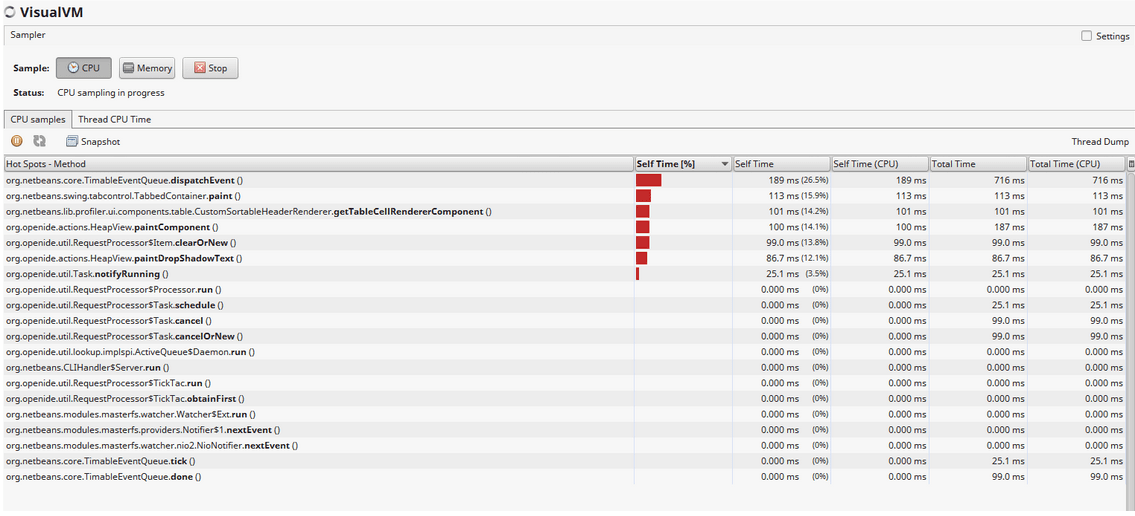
Sampler and Thread CPU Time
If you want to profile your Java application both FusionReactor and Java VisualVM give you the tooling to do it.
The sample page in VisualVM allows you to record the CPU usage by each thread
FusionReactor CPU profiler
What about the Java Visualvm alternative FusionReactor? It gives you a lot more capabilities with a cleaner UI. You have to open the Profiler Page to use the live Profiling feature.
On this page, you can:
- See the Stack Trace page(same as we discussed in the Thread section)
- On the Stack Trace page, you can click on each method in the stacktrace and see decompiled source code of the underlying class
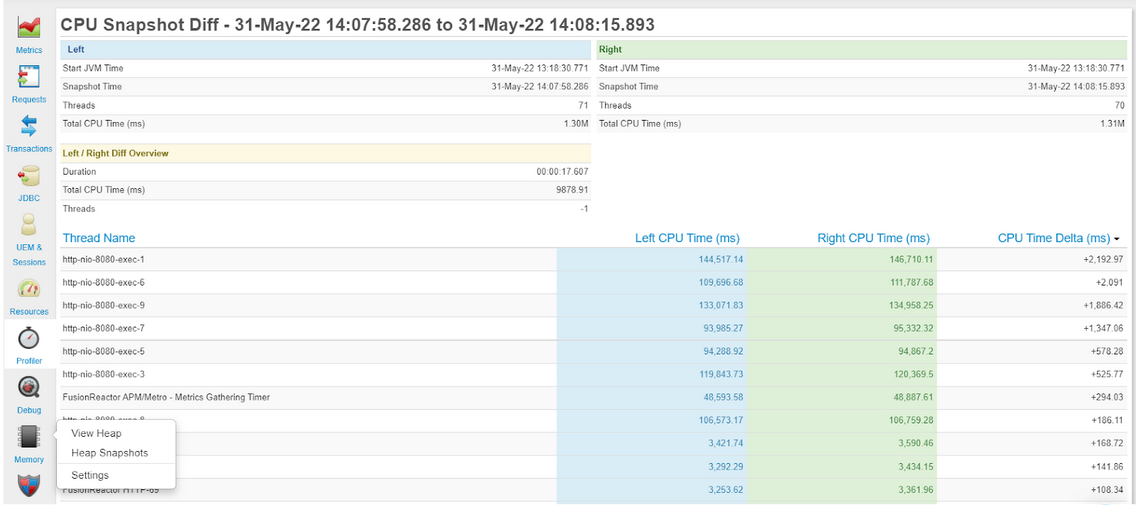
- Using the “Delta” capability in FR, you can compare thread CPU information in real-time
- The snapshot feature will allow you to take CPU snapshots and then perform a Diff of any of those snapshots in a simple-to-use interface
System resources
Sometimes, the cause of performance issues originates or is the result of interactions outside the JVM. In these cases, a reasonable first step is to check the resources of the machine running the Java process. VisualVM unfortunately does not report metrics for the host machine. In the case of Linux hosts, one would usually connect to the server over ssh and use command-line tools like top and ps to view machine resources.
System Resource monitoring with FusionReactor
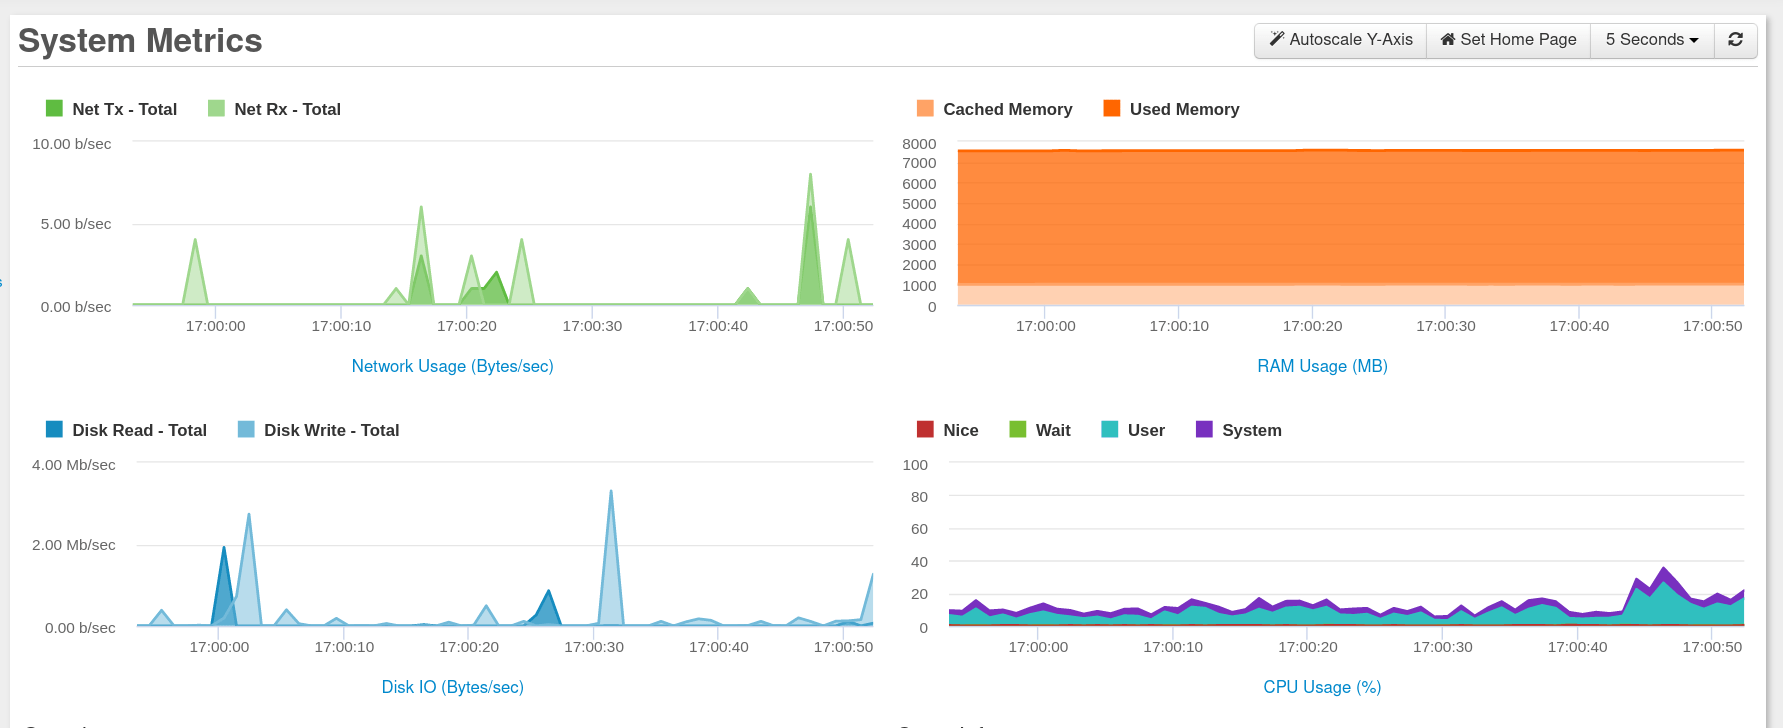
FusionReactor serves this use case with its convenient System Resources tab. It plots several useful machine metrics.
In the System tab, you can check
- Network. How much data the host machine has sent over the wire
- System memory
- CPU usage
- Disk usage. The read/write ratios over some time
- Processes. All the processes running on the host machine
As with the other metrics, this data is persisted on our servers so you can respond to and understand incidents after they happen.
If you need to find performance issues in your system resource, then the Java Visualvm alternative, FusionReactor, does this well.
Plugins system
Java VisualVM has a few Plugins that you can install with the View->Plugins button. Most of these plugins only give you a few features to an existing VisualVM tab (for example, threads inspector and JVM probes)
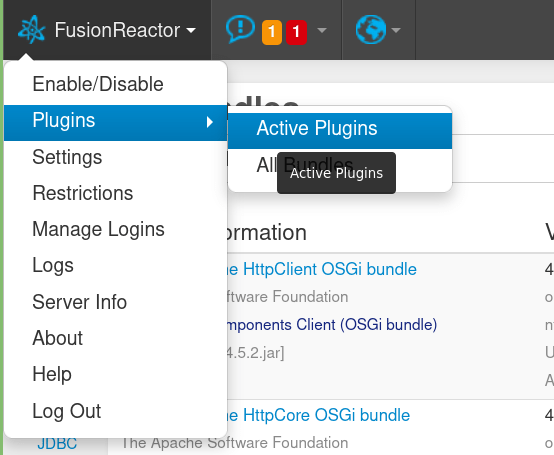
On the other hand, the Jvisual VM alternative FusionReactor plugin system brings a lot of integrations with popular frameworks and cloud providers
- Templating solutions (such as Apache Mustache)
- OSGi (Apache Felix, Apache HTTP OSGI bundle, etc.)
- Message queues (Apache Kafka)
- Servlet Containers (Tomcat, Jetty, etc.)
- Cloud providers (AWS)
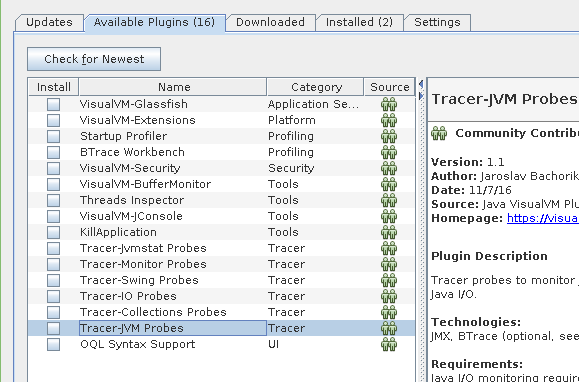
- Deadlock detector And a lot more. You can see the list of all available plugins in the Plugins tab
Therefore if you want to expand the capability of your tool, then the Java Visualvm alternative is a better solution.
Performance Impact
I’ve used Java VisualVM in my development environment, but I was reluctant to deploy it in a production environment due to the high impact it had. Visual VM is instrumenting the classes that are loaded within the Java process. This means the byte code of the loaded classes is updated – and corresponding hooks are inserted into the code that takes over the counting of object instances.
My experience was that you should not touch Visual VM during the instrumentation phase; otherwise, we sometimes waited ages for feedback and sometimes had to shut down Visual VM. We did not experience this with FusionReactor, which is a production-grade tool. Therefore FusionReactor is an excellent Java Visualvm alternative when considering performance impact.
Is FusionReactor a Java Visualvm alternative?
Java VisualVM (jvisualvm, which is also known as jvisual) is a great tool for simple Java profiling. Jvisual alternative FusionReactor brings profiling to the next level to meet the needs of your organization’s production applications. A web-based client allows anyone to see key, real-time metrics when it matters. From JVM and common host machine metrics to live debugging and tools to harden your application’s security(both of these features were not covered in this blog). FusionReactor can help you reach your observability and live operations goals. If you are wondering whether FusionReactor is the right observability solution for your project, please feel free to reach out for a personalized demo at FusionReactor.


