
Introduction To Application Checks
Testing before you deploy to production can only do so much in preparing you for when the application goes live. Small changes in environment and user behavior can cause unforeseen issues that you should be aware of to protect yourself. As a technical support engineer, I have worked with many customers on various issues in their customer-facing environments. I have developed a list of 5 application checks to be aware of in your application. Once established, they will save you time, stress, and effort if issues arise.
This can apply to new applications, application updates, and also generally what to look for if you are first adding a performance monitor to your applications.
You can apply this to any language or environment. So whilst FusionReactor will give you the tooling to run these checks on CFML or Java applications, it applies to all applications and can be done with other tools.
The link to my latest Webinar on this matter is linked below.
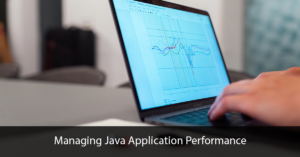
Benchmarking Performance
The first of these application checks to establish is benchmark performance. In essence, you want to know how your application is performing when it is under actual load.
Synthetic testing, benchmarking tools, and staging environments can only do so much to prepare for a release because:
- Users can do something you don’t expect
- Higher traffic can cause increased data
- User data and test data can be shaped differently
The metrics I will establish first are typically:
- Response times
- Database activity
- Throughput
- CPU usage
- Memory usage
- Error count
- Uptime
The metrics you need will depend on your environment and how you choose to deploy and monitor your applications. Still, you want to define a list of base metrics. Add or remove metrics as you learn your application’s behavior.
The reason these metrics are so vital is that they give you a point of comparison. Whether the benchmark is good or bad, it establishes a target. If you feel some metrics are out of acceptable scope, you can aim to reduce them.
If you have a future release, you can compare these metrics to your original values. See if performance is degrading over time as new features are added.
In FusionReactor, you can view these metrics at a server or application level. But you could also use other APMs or monitoring tools built into your environment like Kubernetes or cloudwatch.
Error Detection
When you push to a new environment, errors can creep into an application. Whether that be due to excess load, different user actions, or configuration changes, it is crucial to ensure these errors are discovered and investigated.
Being sure that when you push any changes there are no errors is crucial for customer success. Forewarning users of an error or at least assure them you are investigating the issue is one of the best ways to keep the customer calm and backing your product.
FusionReactor has automatic error detection and can capture the full context of an error. If you require further investigation, you can also use the integrated debugger in any environment production.
Other tools such as nerd vision, Bugsnag, Sentry and some frameworks have built-in error capture to isolate an issue in similar ways.
Resource Usage
Resource usage is no longer a case of monitoring and increasing the resource you can throw at a server until it is stable. While this may patch a problem, in the long run, it is not sustainable.
With the move to microservices, containers, and hosted platforms like AWS or google cloud, having small and stable apps is paramount to save both engineering resources and running costs.
Specifically for Java and CFML environments, the key resources to focus on in my experience are CPU and memory usage. Often poorly configured memory can lead to higher CPU and CPU and memory issues are closely linked.
You want to pay particular attention to the CPU and memory your application uses, the individual memory spaces of Java, and the resulting garbage collection of this.
While tuning garbage collection can be beneficial, getting it right is often trial and error, with minor tweaks, so you want to keep a close eye on it.
Other metrics you may want to be aware of, especially in hosted environments are network traffic and disk, as these are not always free and can quickly add up.
Monitoring resources is all about refinement and managing your running and maintenance costs.
FusionReactor has metrics and alarms built-in for resource usage, you will find you can also often do this with tools built into your environment like system monitors, cloud watch, and tools like JvisualVM for java.
Background and Asynchronous Tasks
Background tasks and asynchronous programming can make processes much more efficient and automated, but the trade-off for this is that they are not always easy to monitor.
They can often be the invisible killers of an application without anyone realizing it.
Especially in multi-threaded languages such as Java, it is important to keep an eye on your background processes, the threads they are running on, and how expensive they actually are.
Debugging these sorts of issues can be tricky as tasks do not necessarily run in line.
Monitoring your thread state and resource usage is another of these application checks and something you can do very quickly in FusionReactor; from that view, you can also profile the threads to get a picture of what that background process is doing and how much time it is taking.
Using other APMs, or monitoring tools such as JvisualVM will also provide similar data.
Alerting On Potential Issues
The first 4 application checks covered what to look out for in an application, however for the most part establishing this information is a manual process and having someone constantly check the application for any changes is not an efficient use of time.
The 5th and final step is to add some automation to your process, take the data you have gathered and add alerts to notify you of any concerning behavior changes.
For some with an around-the-clock operations team, these alerts can be immediately actioned. You can take a look at the alert and try to establish the root cause of the issue.
It may not be possible for others to action every alert immediately, but having an awareness of what time alerts happen is a powerful step to identify what is or was happening.
With your alerts, you want to identify acceptable boundaries for your application, in terms of benchmark metrics, error count, resources background processes (if possible). These alerts should go to a platform that you actively monitor, so if you only check email twice a day, maybe use slack or another tool instead.
The types of alerts to consider would be:
- Potential loss of service
- Application instability
- Application metrics going outside an acceptable range
- Any event where you may need to be proactive and not reactive to an issue
In FusionReactor, you can alert on any collected metric and alert to most tools. An example alert could be on the error count for my application, one error a minute is acceptable but if I see two or more I would want to know.
There are plenty of alerting tools out there. Some that can integrate with your infrastructure to scale or redeploy on an automated basis.
Summary Of Application Checks
In summary, you want to know how your application is performing, what errors are occurring, how much resource your application is using, and are there any harmful background processes running. You want to know what your base metrics are, compare them if you make any significant changes, and know if the applications are not behaving as expected.
As I mentioned at the start, these application checks in my case have applied to a Lucee app but they can apply to any application in any language.
Being proactive in these steps can take time, but from someone who spends a lot of time looking into other people’s environments, I can confidently say that in the long run, it pays dividends.