Nowadays, Java Application Performance Monitor (APM) is doubly important because Java-based applications enable many critical IT services to run a business enterprise smoothly. Additionally, several production installations utilize home-grown application components which run on Java application servers. For example, Oracle WebLogic, IBM WebSphere, SAP NetWeaver, Apache Tomcat, JBoss, and many more, which puts a greater emphasis on the need for Java monitoring.
Since the Java middleware tier handles the custom rules and algorithms that handle the exchange of information in a business environment, the impact of the Java middleware tier on the productivity of the business services it supports cannot be overstated. This, therefore, makes it extra important to constantly keep an eye on the Java Virtual Machine (or JVM), because is it responsible for running both client-server and web-based applications. Monitoring the JVM can help understand the issues of performance affecting the supported business services.
Similarly, the application’s performance is also impacted by how well the web containers/application servers upon which the application components are hosted handle their responsibility. This is important to note, as Java application performance can be affected by the application logic and transaction flows between components of the application, method calls, third-party API calls, database queries, and more.
This article will monitor the JVM layer and provide evidence to showcase how careful Java monitoring can help understand the root of complicated issues regarding performance. We will discuss how FusionReactor and its in-built capacity to monitor JVM adequately helps developers quickly identify and resolve issues with little to no downtime.
Why Is The Java Virtual Machine So Important?
At the heart of the Java, middleware tier is the Java Virtual Machine. This component is an integral part of the Java structure and makes up part of the Java Runtime Environment (JRE). The Java Virtual Machine serves as a foundation upon which applications can be run, and Java code can be executed. The JVM interface is independent of the underlying operating system and machine hardware. It possesses the unique advantage of running code written once in several places; it is therefore referred to as a virtual machine.
How Does The JVM Work?
Instead of independently producing native executable code, the Java compiler creates byte code. This is a highly optimized set of instructions that is platform-independent and executed by the JVM. A program code is derived from source code and translated into low-level code to be deciphered by a software interpreter. The JVM further translates the byte code and in addition, carries out the appropriate native machine instructions.
The JVM functions by:
- Loading byte codes from the class files of an application
- Verifying the loaded byte codes
- Connecting the program with required libraries
- Assigning the amount of memory needed by the Java program
- Handling calls between the program and host environment
- Managing heap and non-heap memory and collecting garbage
- Handling the creation, execution, and synchronization of threads.
Custom byte code instrumentation no longer has to be developed to look at the internals of the JVM. Newer models (such as JVM 1.5 or higher) are fitted with substantial abilities that monitoring tools can benefit from through agent-based or agentless monitoring. Agent-based monitoring makes use of an agent that is installed on the system. On the other hand, Agentless monitoring utilizes an agent that does not reside within the server hosting the target JVMs.
Listed below are the metrics and details that can be observed concerning the performance of the JVM.
Metric: JVM Resource Usage
Observable Details:
| Metric | Observable details |
| JVM Resource Usage | Usage of memory used by programming languages, the Eden space, the survivor space, and the tenured generation heap. Memory usage by non-heap related features such as the field and method data, observation of pool code cache, and the permanent generation heap space The degree to which the JVM is utilizing CPU resources |
| Metric | Observable details: |
| Server OS visibility | Monitoring of the inflow and outflow of traffic to the service platform Server uptime, the activity of disks, CPU and memory stats |
| Metric | Observable details |
| JVM threads | Blocked threads Waiting threads High CPU threads Peak threads Low-priority threads Deadlock threads |
| Metric | Observable details |
| Java Classes | Loaded classes Unloaded classes Total classes |
| Metric | Observable details |
| Garbage Collection | Monitoring of the total number of garbage collection operations The measurement of the amount of time required to collect garbage A percentage analysis of the amount of time spent by JVM in collecting garbage |
| Metric | Observable details |
| Connection of the JMX to the JVM | Availability of the JMX Average response time of the JMX Observable changes to PID |
Critical Performance Questions That Can Be Solved By JVM Metrics Monitoring
- How much does the CPU utilize the JVM?
- Which threads can be held accountable for CPU usage, and what line of code is each thread executing?
- At any given time, how many threads are simultaneously running on the JVM?
- Are there any thread leakages by the abandonment of running threads?
- Are there any JVM deadlocks? If yes, what lines of code are responsible for it? What lines of code (including module, classes, and files are responsible for it?
- What are lines of code responsible for blocked threads (if any?
- How long does it take for the JVM to collect trash? What is the overall efficiency of the system?
- What object are types responsible for the JVM memory usage, and what is its heap usage?
- When was the last JVM startup time?
- What is the JVM’s uptime?
We will give practical examples of how developers can easily identify and troubleshoot the root cause of several popular categories of performance problems simply by utilizing Java monitoring. These problems have an impact on the productivity of java-based business services.
The first illustration covers how to deliver better software faster with Java monitoring. It reveals how you can easily track and therefore identify the exact problem responsible for any malfunction. In the second example, we will consider how to fix issues through profiling. In addition, we will illustrate how you can get a clear picture of what a thread is executing and any obstacles in its way through JVM monitoring. Let’s begin.
Illustration 1: How To Deliver Better Software Faster With Java Application Performance Monitoring
Using FusionReactor for Java APM helps drastically cut down on the amount of time required to identify, diagnose, and troubleshoot code issues. Ranging from errors to bottlenecks, slow-running applications, and more.
The fully customizable dashboard feature allows highlighting and grouping any issues in the system. The dashboards give access to more specific metrics regarding what the root cause of the problem is.
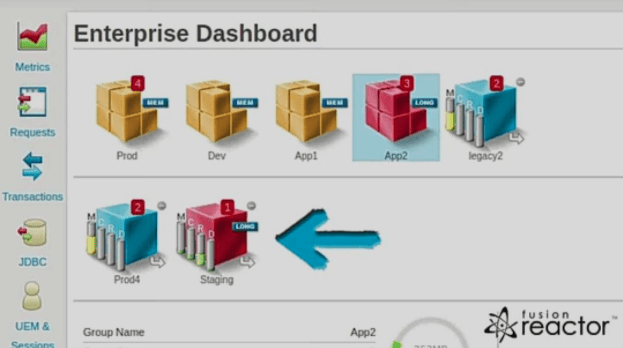
In Fig 1, one server is in an error state.
By digging into the particular instance, you can therefore gain access to detailed metrics regarding the instance, such as CPU, database, memory, and request activity. FusionReactor gathers other metrics data for JVM memory, threads, network, disk usage, and more. Detailed transaction metrics help you trace the root cause of problems.
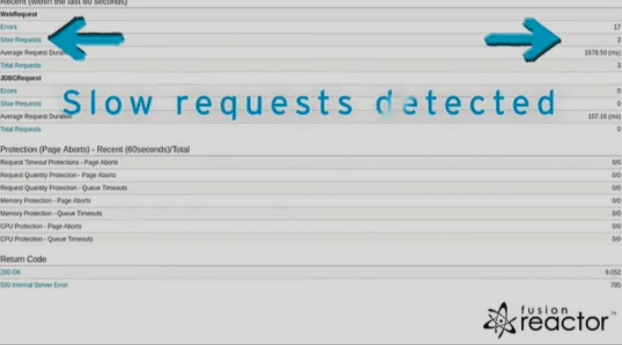
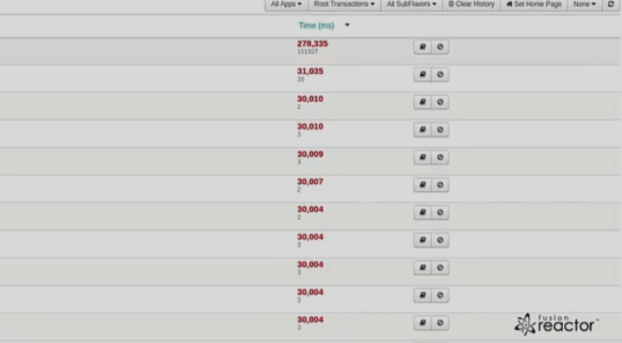
In the figure below, this particular instance has a slow request, therefore explaining why it is in a state of error.
We can see in the figure below that the culprit was a write file JSP file by viewing the recent slow request.
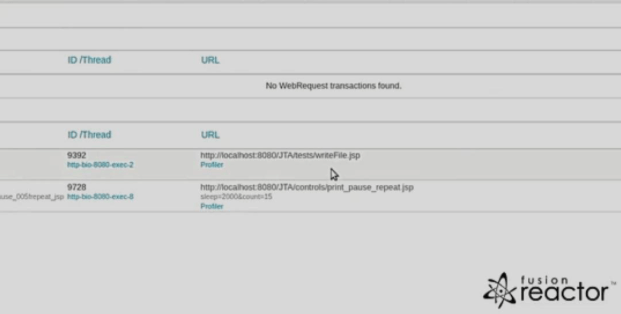
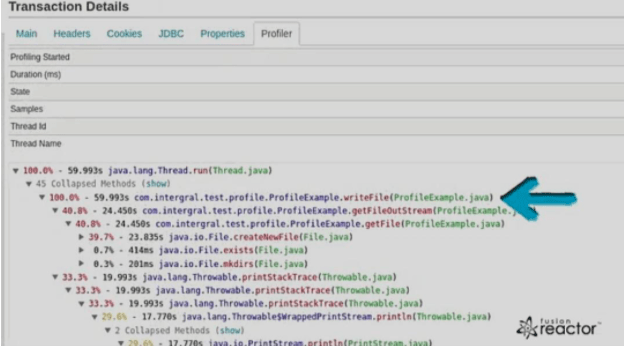
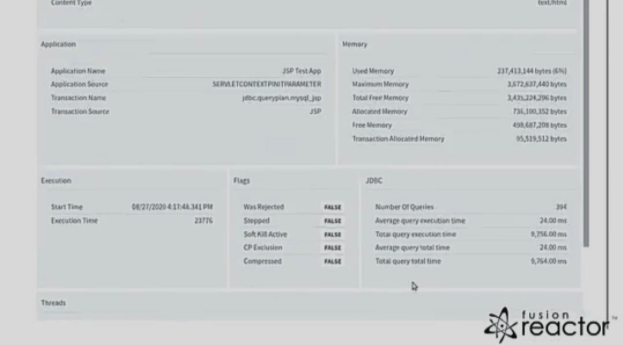
The transaction allows you to view metrics such as memory usage and database activity. In the instance of slow requests, the profile can reveal why the request was so slow. In this case, it is because the request took a lot of time trying to get and write a file to disk. This may mean a problem with the disk itself or that a database or cache would work better to store such large volumes of information.
With FusionReactor, you can easily monitor a Java application’s performance through a high-level dashboard, through to low-level details to help you quickly identify and troubleshoot issues.
Illustration 2: Finding Issues Using FusionReactor By Profiling
By profiling in FusionReactor, you can easily troubleshoot performance issues. The detailed insight allows you to effectively trace issues for slow requests, threads, heap memory, and CPU usage.
The transaction profiler automatically profiles slow-running transactions to give an idea of which methods take up the most execution time. It does so by taking continuous lightweight samples.
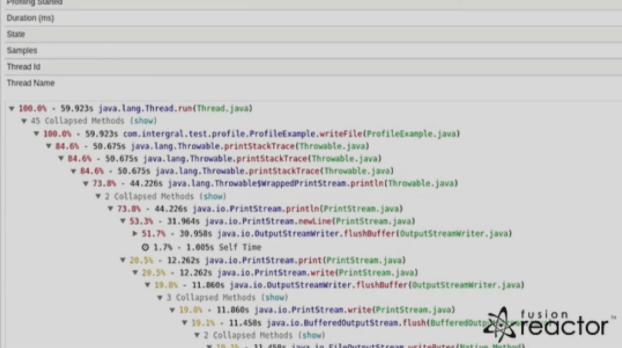
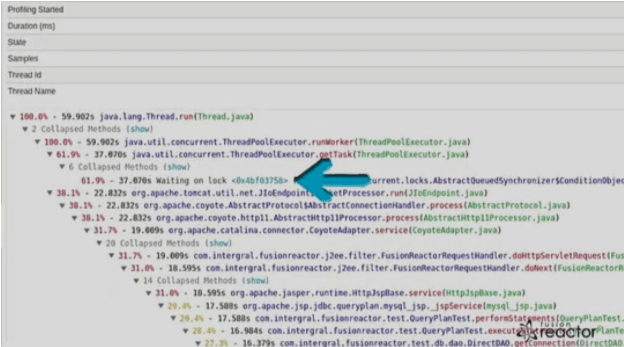
As a result, you can spot performance issues in the application code, locks, frameworks, or the Java engine itself. The figure below illustrates how a particular request spent a lot of time creating and writing to a file, which resulted in it rendering quite inefficiently.
As seen in the figure below, the thread profiler enables profile running threads on-demand, therefore giving a clear picture of what a thread is executing and if any obstacles are in its way. Yellow indicates that a thread is blocked, blue indicates timed waiting, mustard indicates waiting, and green indicates the thread is runnable.
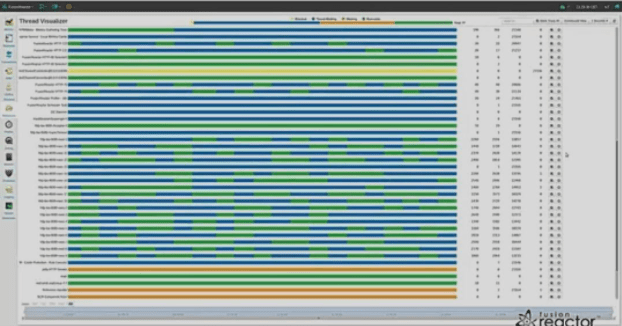
In the figure below, a thread is waiting for a task 60% of the time while executing a JDBC request for the remainder of the time.
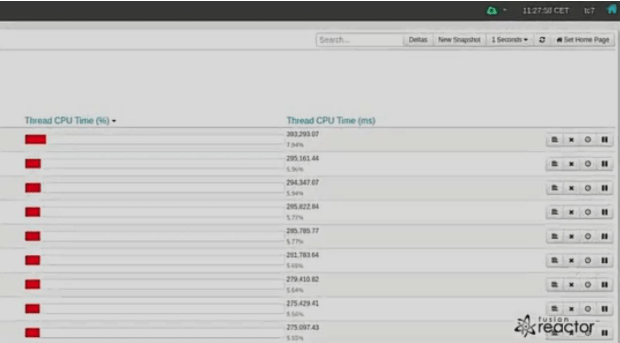
The CPU usage of each thread is tracked by the CPU profiler, which as a result, allows you to see if any background processes or CPU-intensive tasks are running on optimizable threads.
The final profiler, called the memory profiler, enables you to identify objects that consume space in a heap.
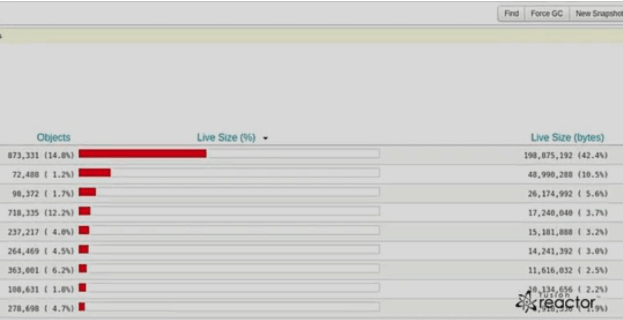
You can inspect individual objects to see garbage collection routes and take snapshots to monitor performance over time.
Illustration 3: Troubleshooting Database Performance
All database requests are tracked as JDBC requests in the FusionReactor. JDBC requests are usually linked to other requests, such as web requests.
You can see a summary of JDBC activity under a web request.
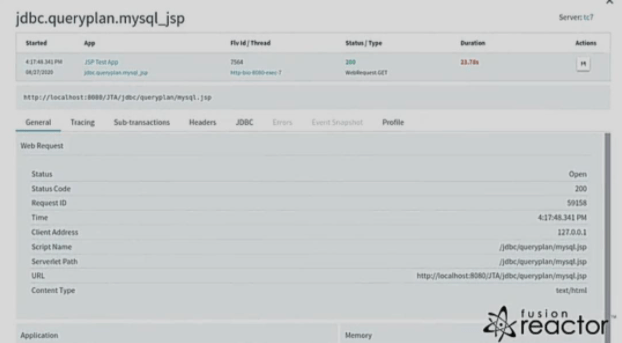
You can view the JDBC tab to gain access to more details on JDBC transactions, including the count of returned rows highlighted in grey.
Requests with sub-transactions such as JDBC, HTTP, and others are analyzed within the tracing view. Requests slowed down by database interactions will have a database symbol on the transaction.
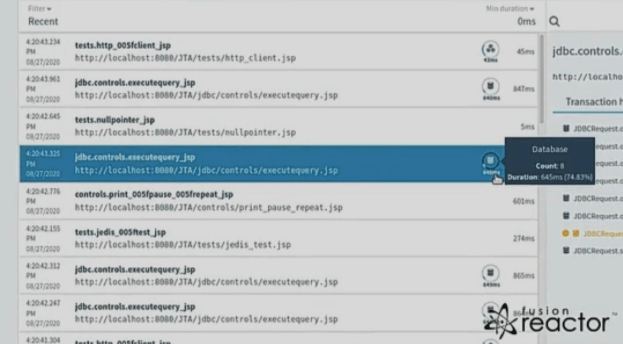
Potential causes of the issue are highlighted in orange.
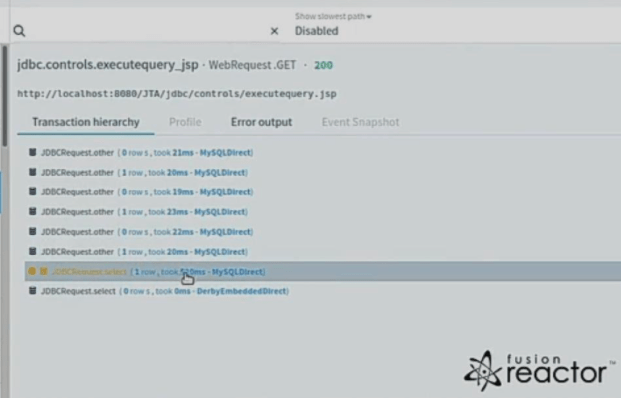
FusionReactor’s query plan further allows you to gain insight into the slow running of queries.
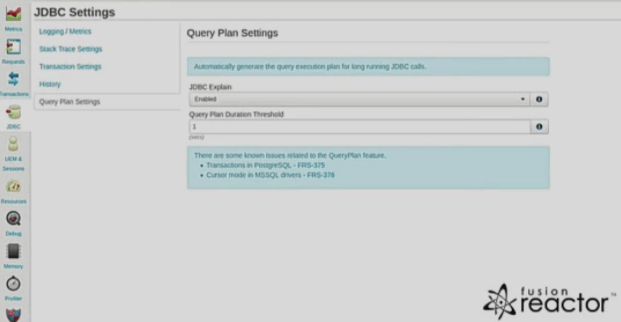
You can rerun queries, thereby profiling and optimizing them without reproducing them manually.
Illustration 4: Using Automated Root Cause Analysis In Java Application Performance Monitoring To See Why Code Is Breaking
Both FusionReactor Developer and Ultimate editions come with an automated root cause analysis tool called “Event snapshot”. The tool generates snapshots if an error occurs twice and immediately makes it available in the cloud to debug issues.
In the figure below, a snapshot is made available in an instance of recurring errors.
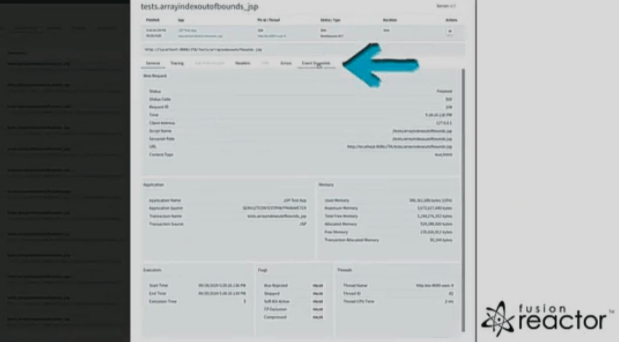
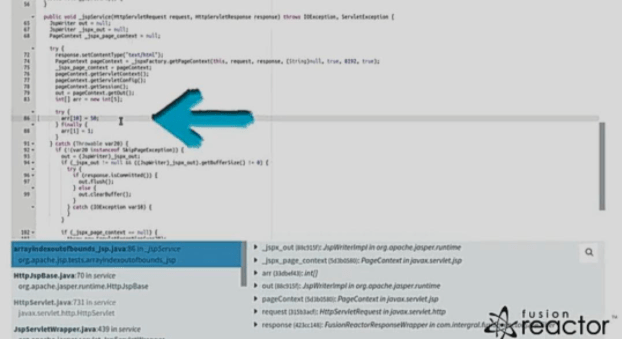
You can also view the source file and line number of the error.
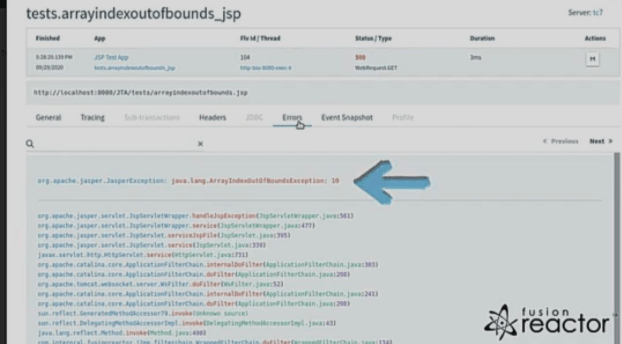
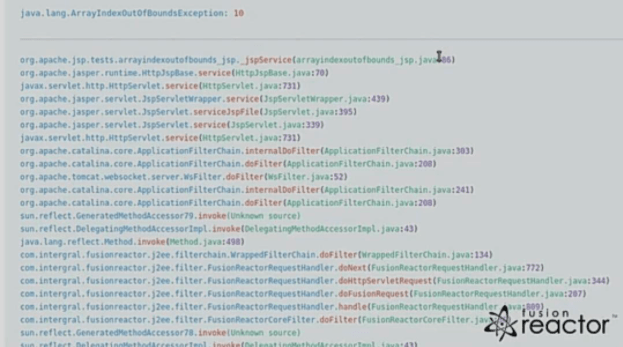
In fig 2 above, it is evident that an array index causes this error out of bounds exception that was thrown in on line 86 of the array index out of bounds JSP page.
You can view a snapshot of the faulty application code alongside other relevant data.
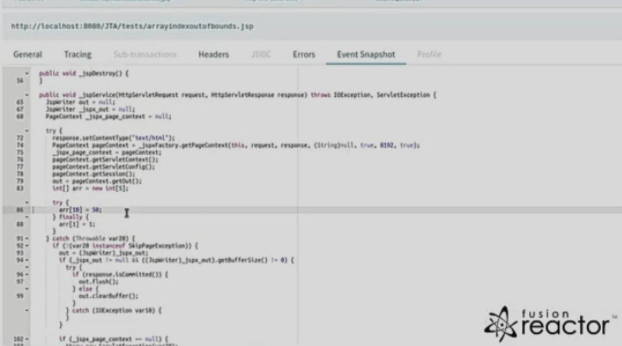
The array out of bounds exception, in this case, was caused by trying to retrieve the tenth element of an array.
Under variables, we can see that the array had only 5 elements which caused the error.
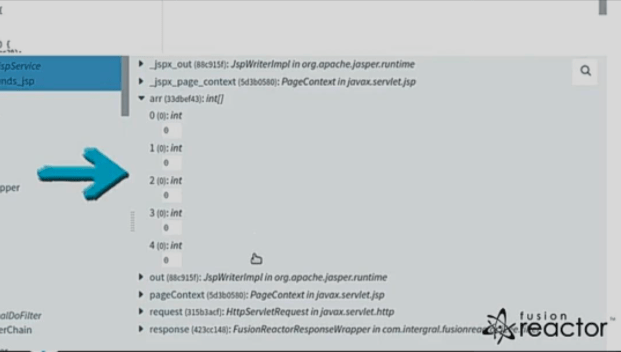
You can fix this error by using a try-catch or making sure that the proper array element is retrieved. These snapshots help you fix bugs quickly without disrupting your service’s performance.
FusionReactor is the best tool for java monitoring you will find out there. Its resources help you effectively track, identify, and fix errors quickly so that your service’s overall performance is not negatively impacted.


