

Short application health checklist to ensure you’re getting the most out of FusionReactor
Configure your notification email address
The notification email address is where FusionReactor will send the daily, weekly, and monthly reports to and is also the email used to send crash protection notifications. If you have not done this already, it’s very important to set this up as soon as possible.
Configure your mail settings within the FusionReactor settings page.
1 – Setup Crash Protection – Get Alerts When Things Go Bad
Crash protection will alert you and attempt to keep your server/application responding when certain events or situations occur. The alerts are usually the first capability enabled, because these will provide critical insight into what’s going wrong and why.
Crash protection can alert you when:
- A request runs for longer than a configured time period (Long-running requests).
- A number of requests run for a configured period (A spike in traffic slowing down the application).
- Heap memory peaks at a certain threshold for a configured period (In case of a memory leak or request consuming large amounts of memory).
- Instance CPU peaks at a certain threshold for a configured period (In case of any resource-heavy background process, request, or event consuming large amounts of CPU).
For each of these alerts, an email can be sent, which contains details of the running requests, resource usage, and a full stack trace at the time the event was triggered.
NOTE: Even when you have set up your notification email, you still need to set Crash Protection email to ENABLED before the email will be sent. You can do this in the Crash Protection Settings.
As well as email alerts you can also queue or reject new requests coming into the application server to reduce load whilst the server recovers.
2 – Check Daily, Weekly And Monthly Reports
Once the notification email is configured, you will automatically start receiving daily reports from your FusionReactor instance, in the report, you will see information on any outages, total load for the day, and number of erroring requests.
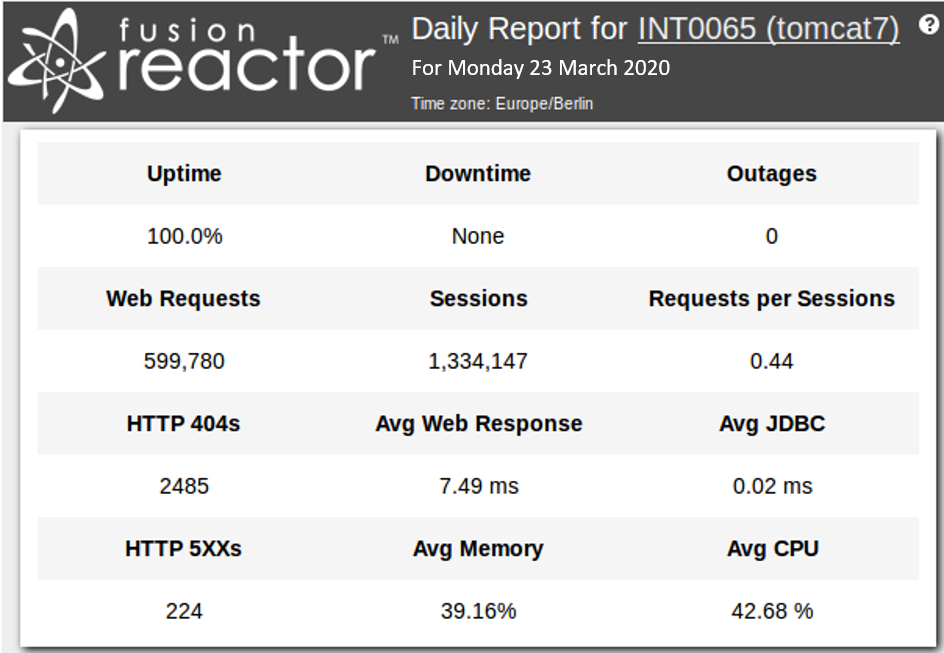
NOTE: All editions of FusionReactor provide a Daily Report – however, the Enterprise and Ultimate Editions also provide a weekly and monthly report.
3 – Review historical Archive Metrics – find behavioral issues
Archive metrics allow you to view your historic log data within a user-friendly interface, so you can go back in time to identify issues and spot behavioral patterns within the application server.
A key issue for maintaining application health is to identify issues post-crash, this can be a challenge as there can be vast amounts of data dumped to log files, and sifting through this data can be time-consuming.
With FusionReactor, we have made this process simple as you can view all the metrics available in the running server but for the past 31 days of captured logs.
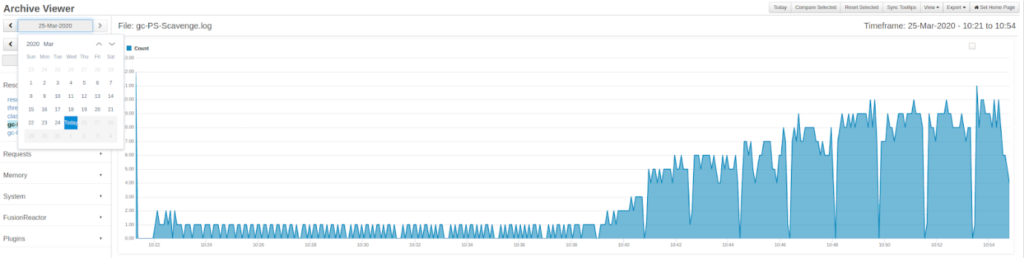
In the example above we can examine the Garbage Collection activity at the time before a crash and see that we had a steady increase until the point the server became unstable and crashed.
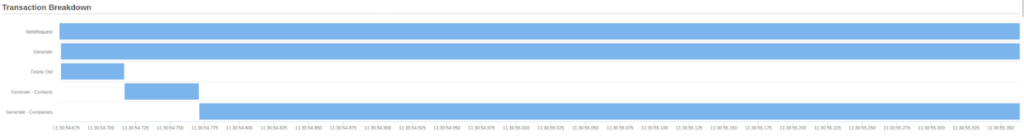
The Relations Tab provides a visual breakdown of sub transactions, which are often database or external service functions. This makes it easier to spot potential performance bottlenecks.
4 – Recognize performance hot-spots from the Relations Tab
If your web request makes any HTTP, JDBC, Mongo, Redis or ColdFusion tag (and many others), these are tracked as sub-transactions that you can see as an overview in the Relations tab of the request and drill into.

5 – See resource details to quickly gauge JVM health
Resources allows you to monitor the health of the JVM and find potential optimizations.
Within resources, you have multiple graphs that allow you to monitor:
- Heap and non-heap memory
- The usage of each memory space
- Garbage Collection time and quantity
- Class loading and JIT
- Thread state and activity
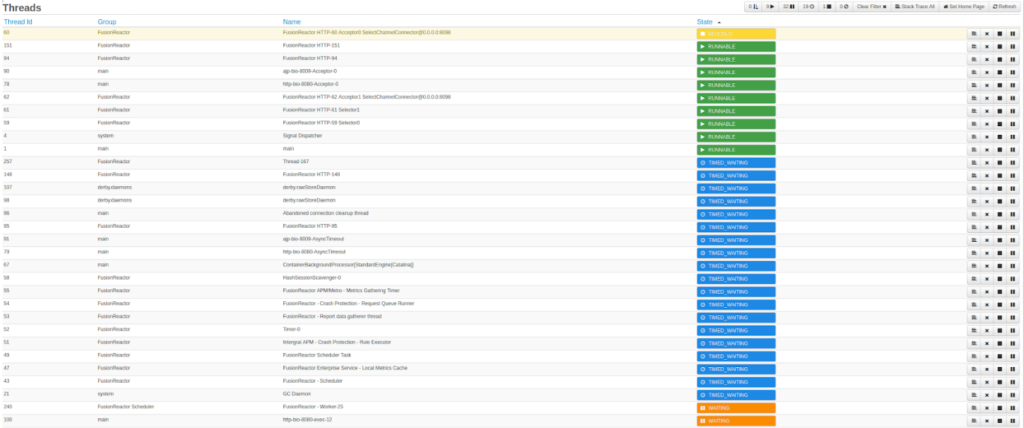
From the Thread’s view, we can see the state of each thread in live time and perform a stack trace to see what each thread is doing.
Book your FusionReactor Health Check every year
Don’t forget that if you are an Enterprise or Ultimate customer then you are entitled to a free annual health check which will ensure that you are getting the best possible value from your product.