

How to Monitor Non-Heap Memory Using FusionReactor
In order to monitor non-heap memory, we first need to understand what it is. Non-heap memory refers to native memory that the JVM uses for some of its operations. This memory is used for operations such as storing bytecode, class metadata and thread allocation.
In this tutorial, you’ll see how FusionReactor can help you to monitor and manage non-heap memory.
1. Code Cache
Code Cache is the space which is used to store Java bytecode in native memory. The code cache is divided into three separate segments: non-method, profiled and non-profiled code heaps.
- The non-method heap stores non-method code such as compiler buffers. This segment has a fixed size of about 3MB & it remains in the code cache forever.
- According to Oracle, the profiled heap contains:
lightly optimized, profiled methods with a short lifetime.
- From the same page as above, the non-profiled segment contains “fully optimized, non-profiled methods with a potentially long lifetime.”
The tiered compilation that the code cache utilizes ensures better performance than having a non-tiered block of code cache. However, this comes at a significant memory compromise. That is to say, the amount of code generated in the tiered compilation is ×5 as much as that in the non-tiered compilation.
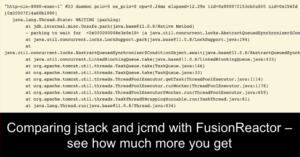
From your FusionReactor dashboard (Resources> Memory spaces) you can be able to see three graphs showing how your application is using Code Cache. The three graphs are: CodeHeap ‘non-nmethods’, CodeHeap ‘non-profiled nmethods’, and CodeHeap ‘profiled nmethods’.
The graph below is for non-profiled methods:
After viewing the graphs from your FusionReactor dashboard, you may notice that a sizable amount of memory has been allocated to these segments. You can set their sizes using the following JVM options: -XX:NonProfiledCodeHeapSize, -XX:ProfiledCodeHeapSize, -XX:NonMethodCodeHeapSize. All these sizes are in bytes.
As mentioned earlier, a segmented code cache takes up much more memory than the non-segmented one. Besides that, having fixed sizes for each segment can lead to memory wastage, for example, if one segment is full but another has free space.
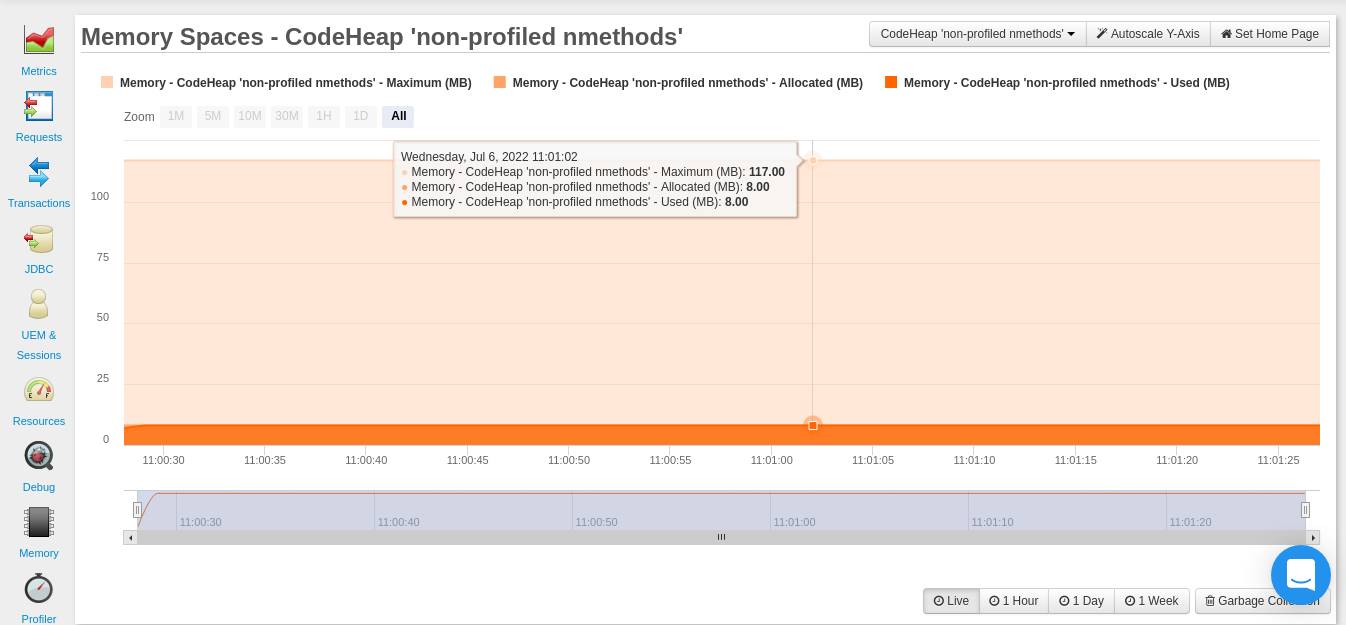
The JVM provides the ability to disable segmentation using the -XX:-TieredCompilation flag. When you use this flag, FusionReactor will also be able to detect that the code cache is no longer segmented. Therefore, you’ll no longer be able to see the graphs earlier talked about. Instead, you’ll see one graph for CodeCache:
After disabling segmentation, there are still a number of ways in which you can reduce the JIT’s memory consumption. However, these methods come at a small performance cost. Therefore, you need to also monitor your application’s performance while you are taking on these measures.
The 3 ways in which you can reduce how much memory the JIT uses are below:
Reducing the Number of Compilations
You can do this by reducing the rate at which compilation is done. There are two JVM options that affect this rate -XX:CompileThreshold and -XX:OnStackReplacePercentage.
The CompileThreshold option affects the number of method invocations before a method is compiled. The OnStackReplacePercentage option is a percentage that affects the number of backward branches a method takes before compilation.
You need to increase the value of these options in order to achieve reduced compilations. An ideal starting point would be tripling the default values for your client JVM. For the server JVM, it may not be necessary to adjust the value of the
CompileThreshold, since its default, is fairly high.
You can check for the default values by using the command below:
java -XX:+PrintFlagsFinal
You can now gradually adjust the two mentioned options while observing the code cache space from your FusionReactor dashboard (Resources> Memory spaces>Code Cache). When you hover over the graph, you can see the Maximum, Allocated, and Used memory space.
Reducing the Code Cache Size
Sometimes an application may have a lot of compilations at the start, but later on, have very little as the program executes. In such a case, you may find it useful to constrain the default code cache size (i.e the maximum given to the JIT compiler).
The -XX:ReservedCodeCacheSize option is used to set this. The idea is to reduce this value (in MB) such that it forces the compiler to flush out methods that are no longer in use.
You tune the -XX:ReservedCodeCacheSize by trying to make the code cache in use to be close to the maximum code cache.
Reducing the Size of Compiled Methods
This involves reducing the inlining that the compiler does when compiling methods. Inlining refers to including the code of another method inside another compiled method. The JVM by default uses certain heuristics to determine the inlining technique to use, with a general goal of optimizing performance.
You can trade some performance benefits for reduced code cache. Below are some of the options you can use for method inlining:
-XX:InlineSmallCode
-XX:MaxInlineLevel
You can read more about the available inlining options from this Oracle page.
2. Metaspace
The Metaspace is native memory that is used to store metadata about classes. This memory allocation is unbounded by default. For this reason, you should monitor how your metaspace grows, otherwise it’s possible to have a scenario where the Metaspace consumes all the memory.
You can monitor how your application is using the Metaspace from your FusionReactor dashboard (Resources> Memory spaces>Metaspace).

To avoid a scenario where the Metaspace runs out of all the memory, you can set the maximum value it can have by using the :
-XX:MaxMetaspaceSize
JVM option. There’s one challenge, however. If the Metaspace size reaches this value, then the program will crash due to an out-of-memory exception:
java.lang.OutOfMemoryError: Metaspace.
This situation is not ideal for a production environment. For that reason, if you want to monitor non-heap memory then you need a monitoring and alerting tool like FusionReactor to monitor how the Metaspace is growing/being used, instead of bounding its value.
Memory allocated to the metadata is freed when classes are unloaded. Class unloading occurs when the JVM does garbage collection. To reduce the frequency with which garbage collection happens, you can increase the value of your MetaspaceSize.
When the memory allocated to metaspace reaches a given value (high-water mark), garbage collection is induced. The high water mark takes on the value of -XX:MetaspaceSize. The default MetaspaceSize is between 12 to about 20 MB, and it depends on your platform.
It’s important to note that the JVM can increase or decrease the high water mark depending on how much metadata was previously freed. The -XX:MaxMetaspaceFreeRatio and -XX:MinMetaspaceFreeRatio determines whether the high water mark is raised or lowered.
If the percentage ratio of the allocated space to the used space for metadata is greater than MaxMetaspaceFreeRatio, then the high water mark is lowered. On the other hand, the high water mark is raised if this ratio is less than the MinMetaspaceFreeRatio.
You can adjust these two ratios while you monitor the Metaspace values from your FusionReactor dashboard (Resources> Memory spaces>Metaspace). When you hover over the graph, you can see the Allocated (MB) memory for metadata and that which has been Used (MB).
3. Compressed Class Space
When the -XX:UseCompressedOops option is turned on and the -XX:UseCompressedClassesPointers is used, the metaspace is divided into two logically different memory spaces. These two options create an allocation for compressed class pointers. This allocation is for storing 32-bit offsets for representing the class pointers of 64-bit processes.
You can use the XX:CompressedClassSpaceSize option to set the size of the memory space allocated for compressed class pointers. The default is 1GB. A scenario can occur where the memory needed for using compressed classes exceeds the CompressedClassSpaceSize value. If this happens, then your application will run into a java.lang.OutOfMemoryError: Compressed class space exception.
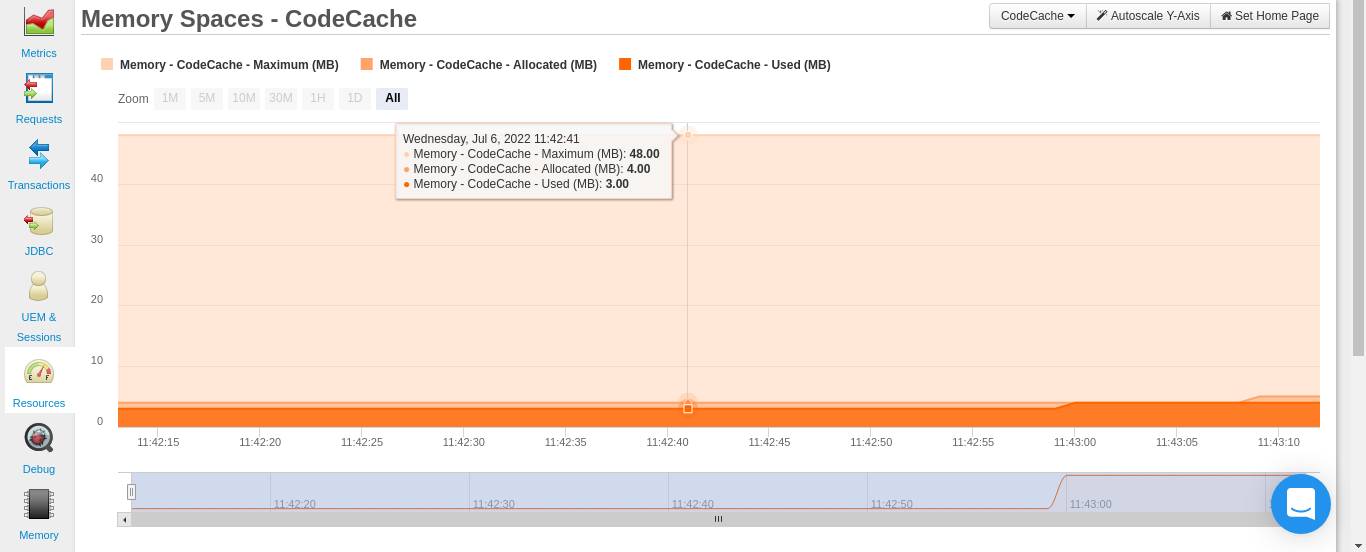
You can monitor how your application is using its compressed class memory allocation from your FusionReactor dashboard (Resources> Memory spaces>Compressed Class Space) to counter such a scenario.
It’s important to note that the XX:MaxMetaspaceSize option applies to space for both compressed classes and for other metadata. Therefore, it’s important for you to ensure that the CompressedClassSpaceSize you’ve set is less than the MaxMetaspaceSize.
4. Garbage Collection
Garbage collection (GC) refers to freeing up heap memory when it gets full. There are four garbage collectors that are available to you.
The JVM automatically chooses which is best for the application. It’s best for you to let the JVM choose for the collector to use at first. If your application still faces issues with garbage collection times then you can begin by adjusting your heap memory.
If this fails, you can now consider selecting a specific garbage collector for your application.
From your garbage collection graph, you should be looking out for frequent garbage collections and long garbage collection times. The graph below (Live time period) shows what an “ideal” garbage collection frequency would look like.

However, since this is a graph for a Live period, you may not be able to observe the outstanding events that you may be looking for. Therefore, you can consider looking at a graph for a longer time period, such as the one for 1 Hour.
There are four garbage collectors that you can consider changing to while you observe the garbage collection times for your application:
Serial Collector
This collector uses a single thread for all its garbage collection. It’s ideal for single processor devices. However, it can also be used on multiprocessor devices with small datasets of about 100MB. You can enable it using the -XX:+UseSerialGC option.
Parallel Collector
Unlike the serial collector, the parallel collector uses multiple threads to speed up garbage collection. This collector is suitable for mid-size to large datasets for multiprocessor devices.
You can set this collector by using the -XX:+UseParallelGC option.
G1 Garbage Collector
This collector is mostly concurrent and it is suited for multiprocessor systems with large memory space. You can set it using the -XX:+UseG1GC option.
Z Garbage Collector
The Z collector is designed for low latency applications that may have very large heap sizes (possibly even in terabytes). It performs its activities concurrently without stopping an application thread for more than 10ms. You can enable the Z collector using the -XX:+UseZGC option.
5. Threads
Every JVM thread has a stack in native memory. The stack stores different thread data such as local variables. You can set the thread stack size using the -Xss option.
The default thread stack size is platform-dependent, but it’s usually about 1MB.
If the set thread stack size is lower than that required for computation, then your program will have a StackOverflowError.
It’s worth noting that the thread stack size can grow as your program runs. If the thread stack size is expanding and it so happens that there’s insufficient memory, then your program will run into an OutOfMemoryError.
You can be able to monitor how threads are using memory from your FusionReactor dashboard ( Resources >Threads). From the Stack Trace All tab, you can be different information about threads, including the Allocated Memory:
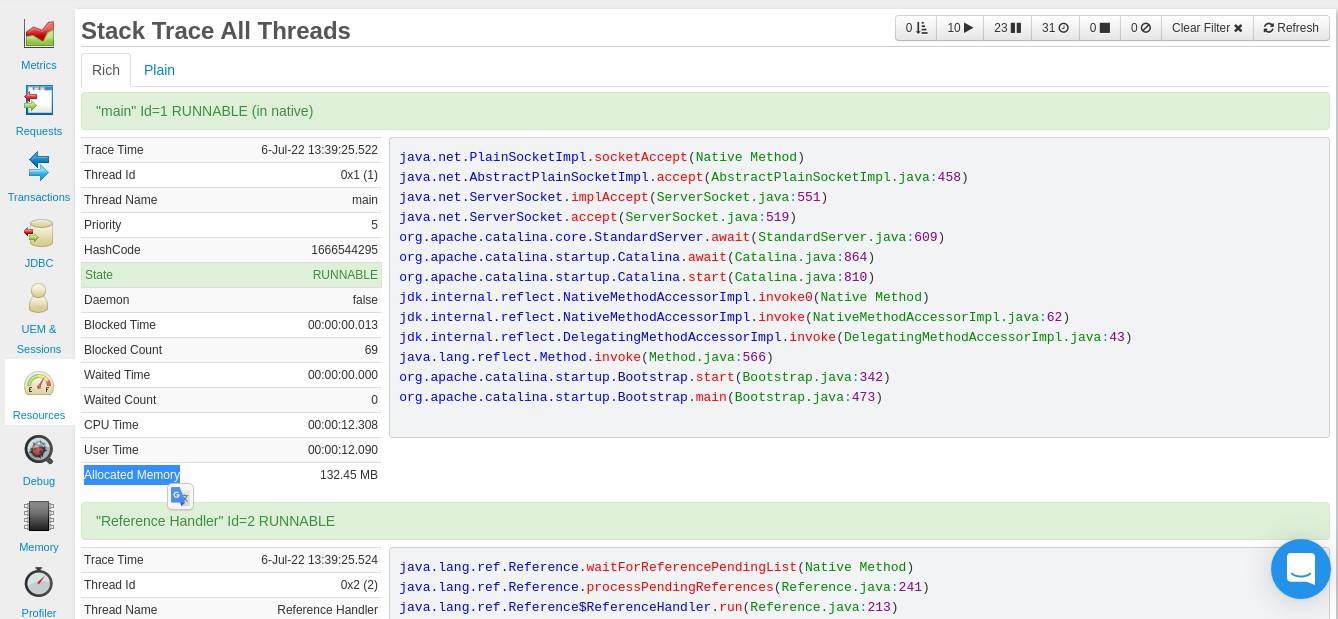
The aim is to look out for threads that are consuming 100s of MBs of memory (or GBs). You can then choose a course of action, such as pausing a thread that is consuming a lot of memory & then debugging it.
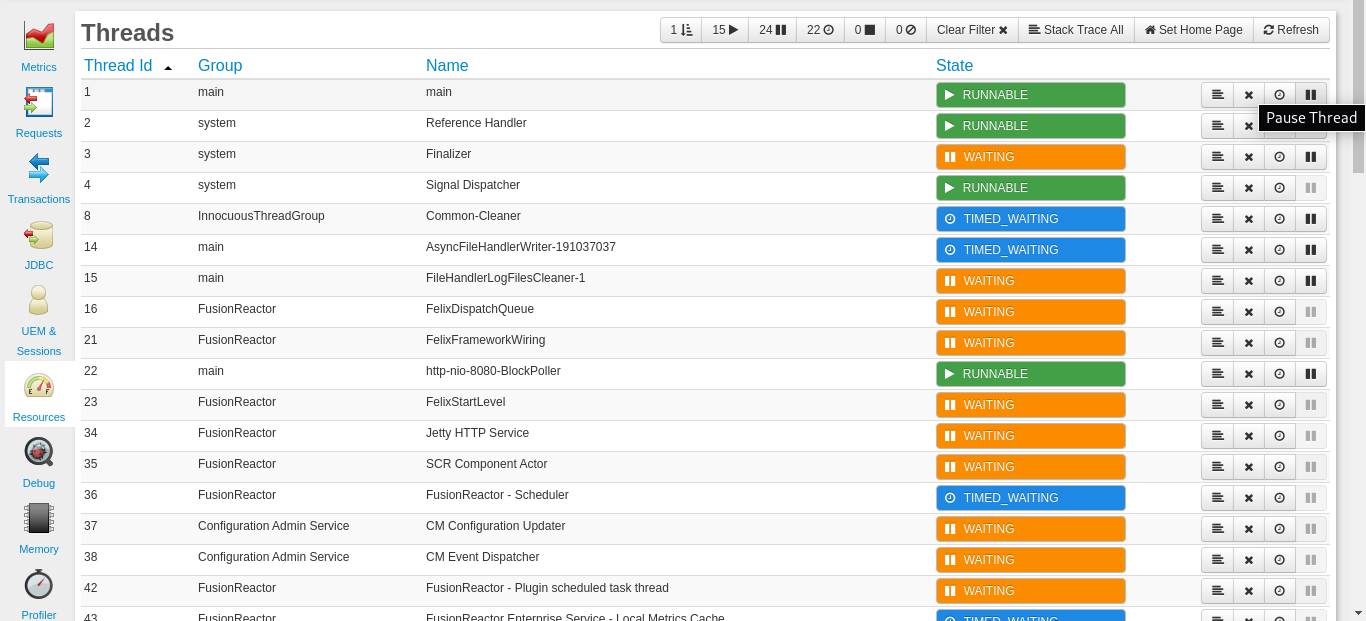
From the Resources>Threads dashboard, you can be able to press the Pause Thread button.
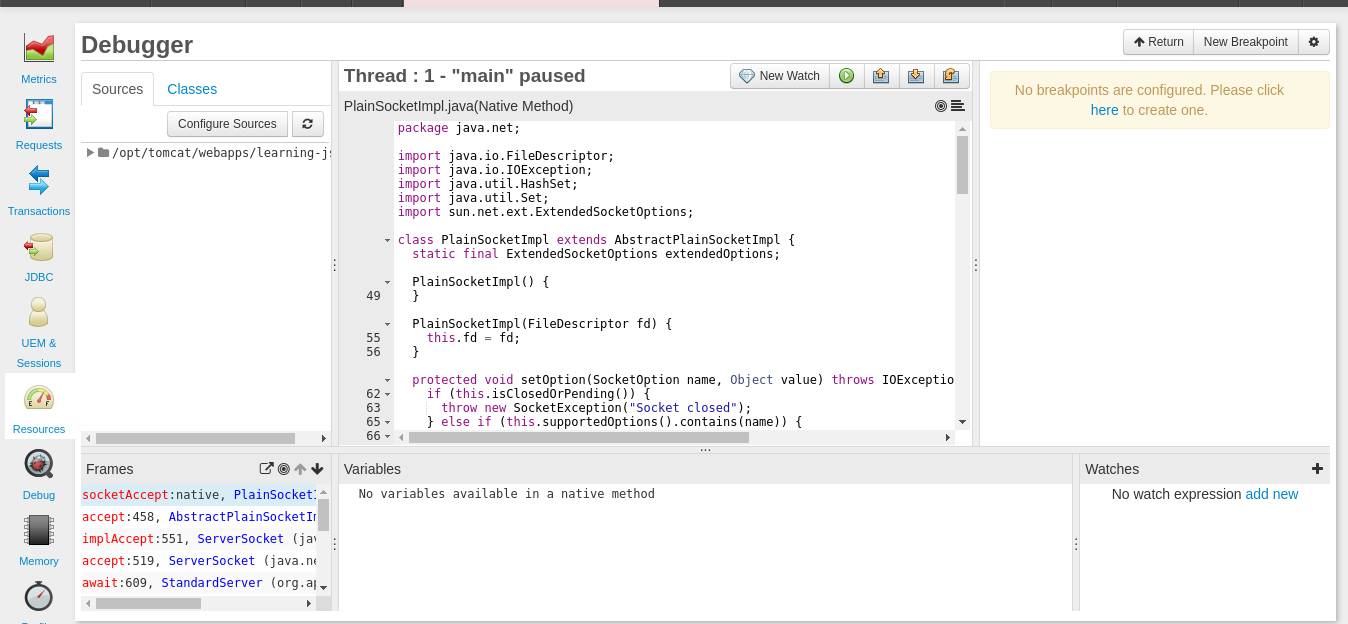
After debugging, you can press the Resume button (next to the New Watch button) to resume the execution of the previously paused thread.
Conclusion – How to Monitor Non-Heap Memory
This article has shown you the various tools that FusionReactor offers to monitor and manage non-heap (native) memory.