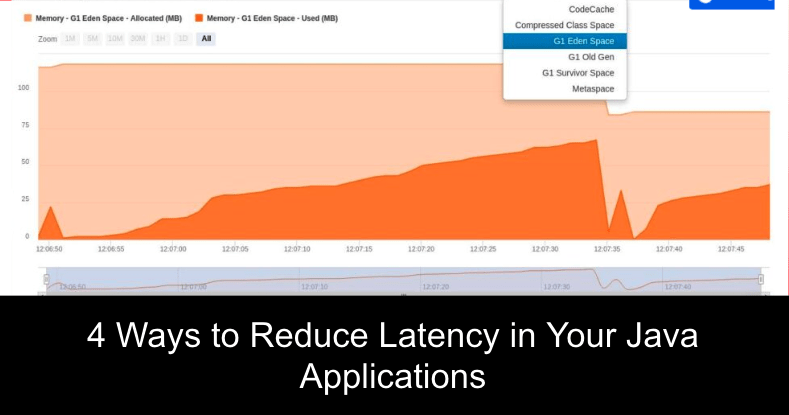
4 Ways to Reduce Latency in Your Java Applications
Latency refers to the processing delay when you run your applications. For your Java applications, this overhead can normally be attributed to the tuning in your Java Virtual Machine (JVM).
The problem of high latency is usually about having non-deterministic instances of long delays even when the general performance is good. For low latency applications such as financial trading systems & gaming applications, you must ensure that there are no long pauses.
As a Java developer, it’s important for you to know how to achieve this. In this tutorial, you’ll learn how you can tune your JVM for low latency:
Determining Latency for Your Applications
There are various metrics that you, as a developer, can use to measure the overhead in your applications. This includes measuring things such as the number of transactions performed per minute or the time to execute a given scenario.
You can have a set of benchmark tests to compare against any scenarios that cross the set threshold. Your interest should be in transactions that cross the set threshold. It is important for you to carry out these tests for at least 20 minutes so as to get an accurate picture of the measurement.
To benchmark your Java code, you can use a tool like Java Microbenchmark Harness (JMH). You can use this tool “for building, running, and analysing nano/micro/milli/macro benchmarks written in Java and other languages targeting the JVM.”
JMH allows you to get benchmarks for performance metrics such as average time, throughput, and time for each operation. If you have JDK 12 and above, then it should already be included in your tool kit.
Reduce Latency in Your Java Applications – Heap size
Heap size is the area in memory where Java objects are allocated. Having a higher heap size directly translates into having shorter latencies. This is because your application will have shorter garbage collections since it has a sizable allocation to include more objects without regularly removing the existing ones.
Java allows you to set a custom heap size for your JVM. Before doing this, you will need to perform benchmark tests to estimate the maximum heap your application will require.
After carrying out these tests, you can now set the minimum & maximum heap using the -Xms and -Xmx arguments, respectively.
java -Xms1g -Xmx2g JavaClassName # sets min heap to 1GB and max to 2GB
However, you need to monitor how your application is using the heap. It is possible that a scenario may occur where your program runs out of heap memory, giving a java.lang. OutOfMemoryError exception. This error occurs when the JVM is trying to add new objects to the heap & yet its memory is insufficient.
To counter such a scenario, you can use the Heap Memory Graph (Resources> Memory Heap) from your FusionReactor dashboard to help you monitor your heap memory usage.
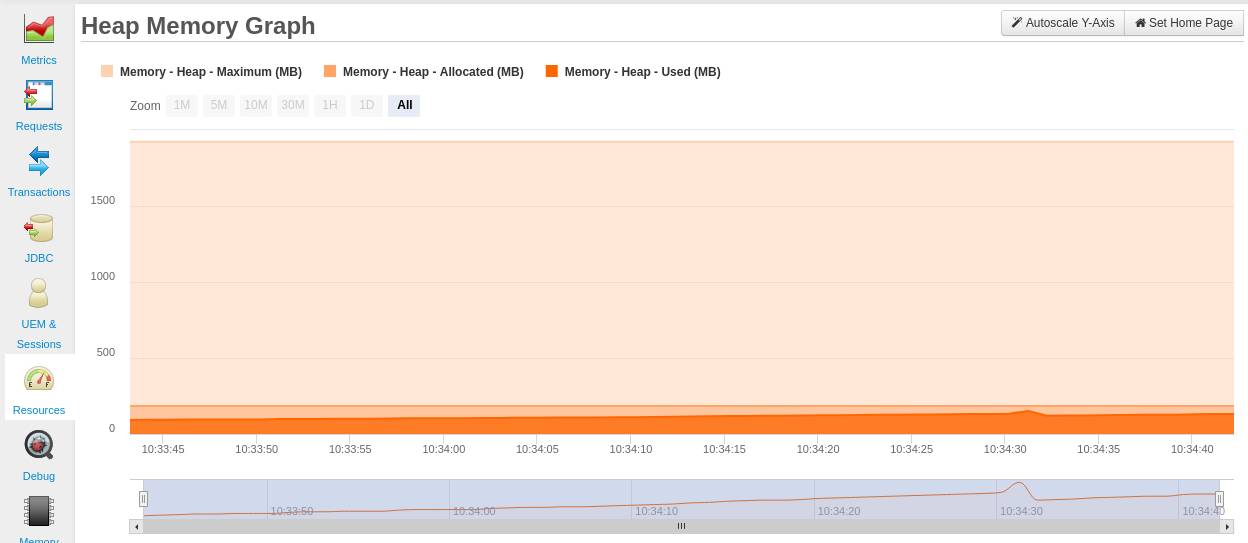
If you notice from your Heap Memory Graph that your Used (MB) memory is growing over time, then there is a need for concern.
This may indicate a memory leak. Therefore, your next step of action should be to debug your code.
When debugging your code, you should look for finalizer methods, very large arrays, & excessive use of static fields. Classes with such objects are not freed from memory during garbage collection & can therefore lead to a memory leak. In case it happens that the java.lang.OutOfMemoryError: Java heap space already occurred, then you can use the stack trace information from FusionReactor to help you identify which method caused the exception.
Reduce Latency in Your Java Applications – Nursery size
The heap is sometimes divided into two sections: the young collection (new generation) and the old collection (old generation). The new generation is divided into the Eden & the survivor space.
The Eden is used to hold newly created objects. The Survivor space is a part of the Eden space. It’s where Eden objects are transferred during collection. From here (the survivor), they can either be collected or promoted to the old generation.
Objects that have stayed long in the new generation are transferred to the old collection (tenured generation).
The main motivation for a new generation is that it frees up memory faster than the old or garbage collection without a nursery. The old generation is larger, fills up slowly and takes up a long time for each garbage collection.
It is important for you to understand that having a large nursery size does not automatically translate into reduced latencies.Your application may end up having long young-collection pause times due to a large nursery.
Therefore, it is necessary for you to adjust the nursery sizes while observing the garbage collection times. You can set the size of the new generation using the -XX:NewSize option. The -XX:MaxNewSize option sets its maximum value. You can also control the ratio of the young generation to the old generation using the -XX:NewRatio option.
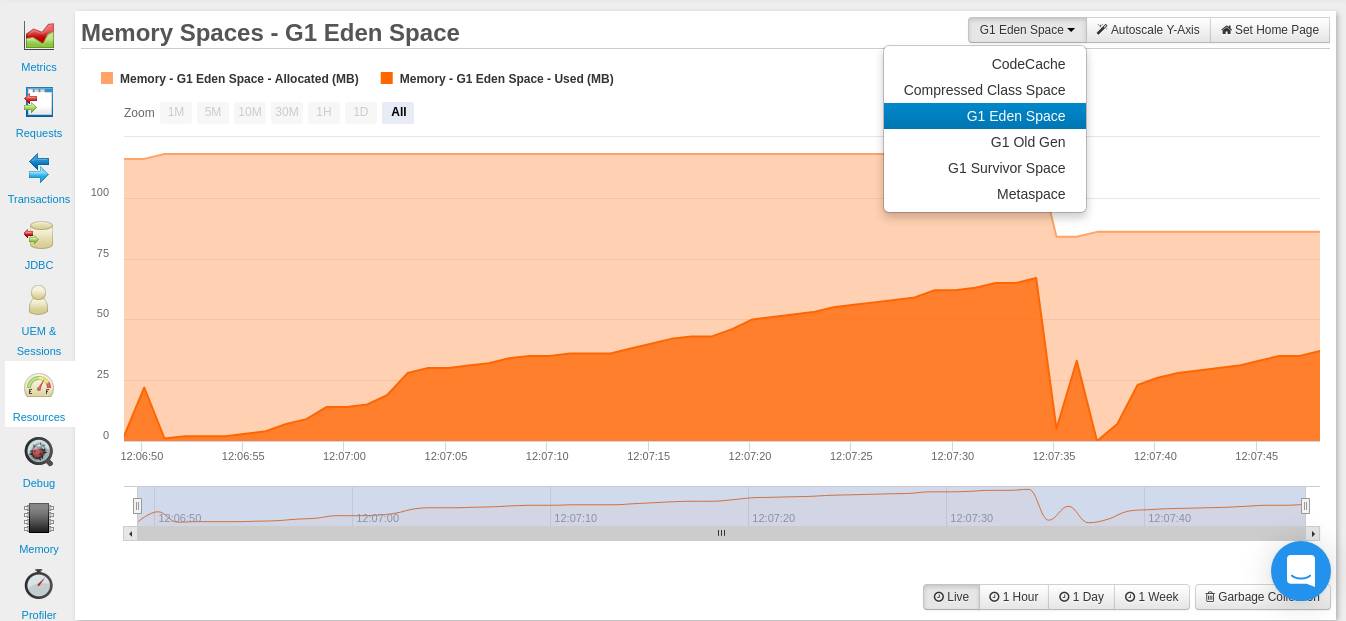
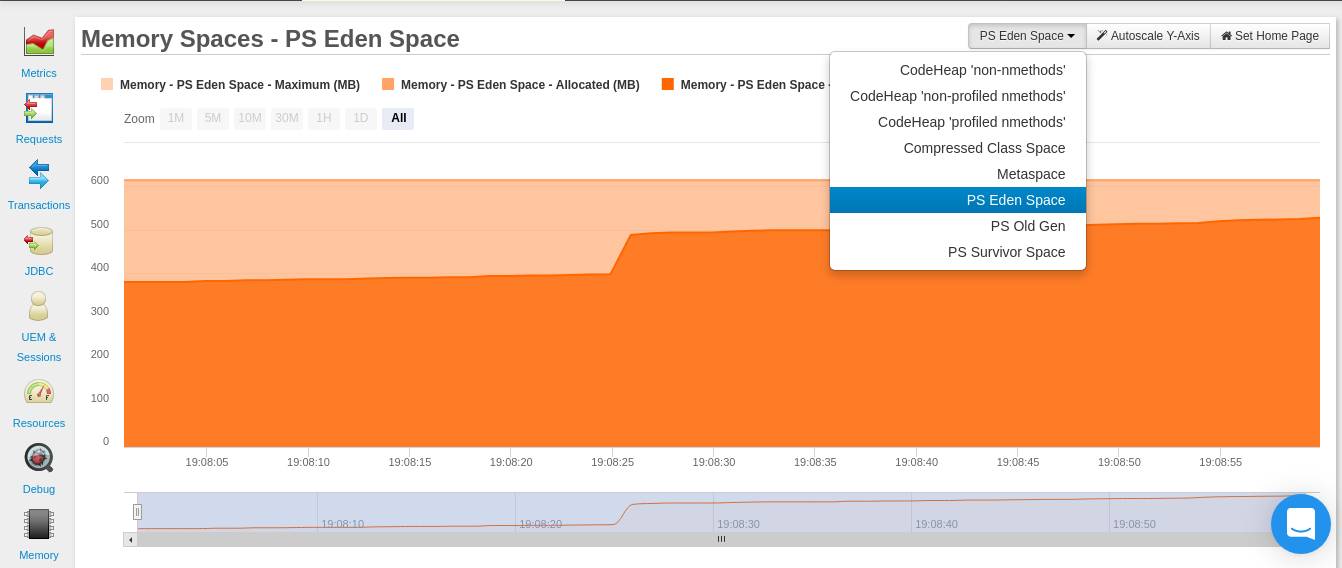
From your FusionReactor dashboard (Resources > Memory Spaces) you will be able to monitor the allocation of your Eden Space, Old Gen and Survivor Space. Please note that the naming of these memory spaces is dependent on the type of garbage collector you are using. The wording is different because the arrangement of the generations in each collector is different. If you are using the G1 Garbage Collector(GC), you will get the the Memory Spaces – G1 Eden Space graph below. The generations are named: Eden Space, Old Gen and Survivor Space.
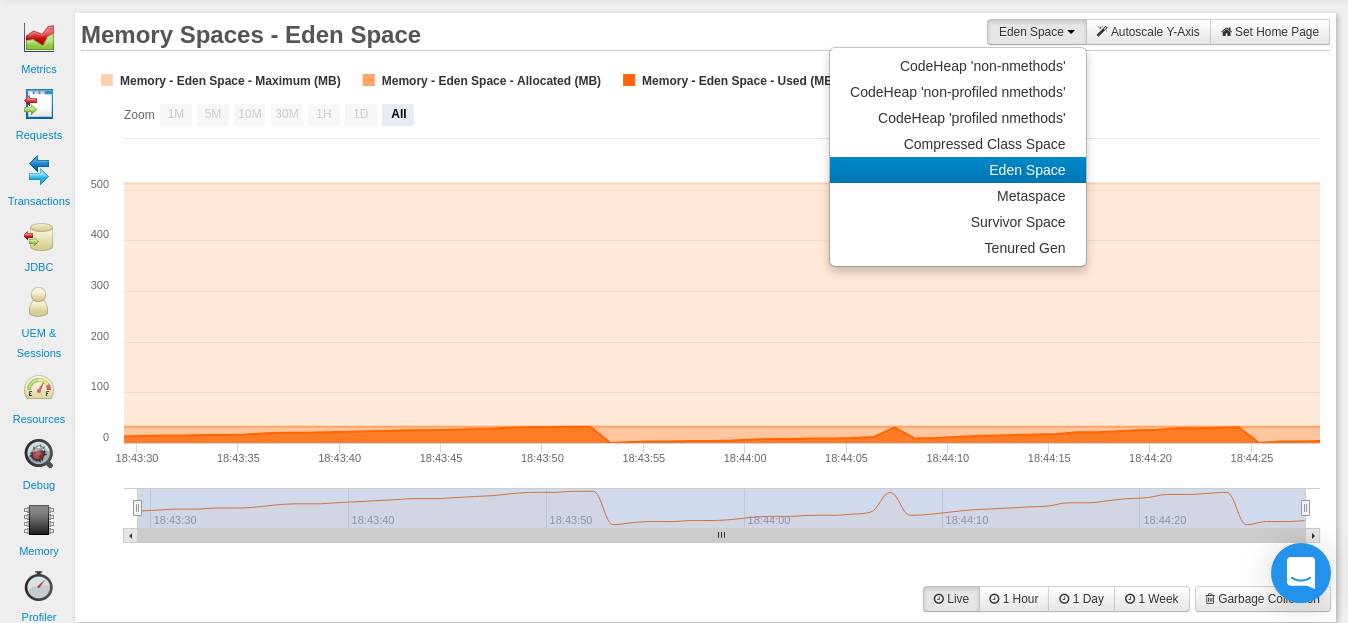
If you are using the Serial GC, you will get the the Memory Spaces – Eden Space graph below. The generations are named: Eden Space, Survivor Space, and Tenured Gen.
If you are using the Parallel GC, you will get the the Memory Spaces – PS Eden Space graph below. The generations are named: PS Eden Space, PS Survivor Space, and PS Old Gen.
If you are using the Z Garbage Collector, you won’t see any generations. Instead you’ll see one memory heap allocation: Memory Spaces – ZHeap.
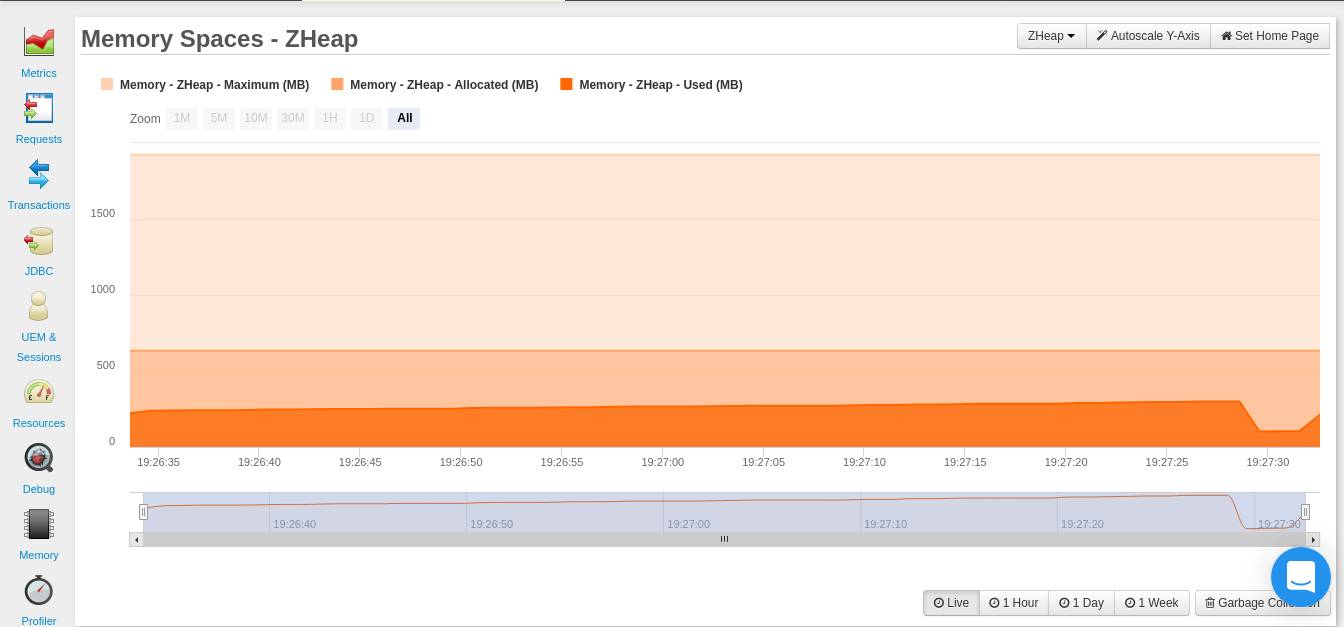
As you can see, the Z Garbage collector isn’t like the other collectors. It is the newest addition to the GCs you can use.
The Z garbage collector is specifically built for low latency applications. The larger the heap size you assign to it, the better.
However, this doesn’t mean that you should waste memory. You need to find a balance between memory allocation & garbage collection. You can set the memory allocation for the Z GC using this earlier discussed -Xmx option.
Reduce Latency in Your Java Applications – Garbage Collection
When the heap becomes full, the JVM must free up space for allocating new objects. This process is known as garbage collection. The type of garbage collector you use determines how the collection takes place.
When garbage collection occurs, the application must first pause while the JVM frees up memory. Therefore, you need to take care to choose a collector that will ensure minimal pause times. By default, the JVM chooses the best collector for your application.
However, choosing a garbage collector on your own may be necessary. This could be because you have noticed long pause times caused by garbage collection.
FusionReactor visualizes your garbage collection frequency and the amount of freed memory (Resources>Garbage Collection). This provides you with insightful data that you can compare against while trying out different garbage collectors.
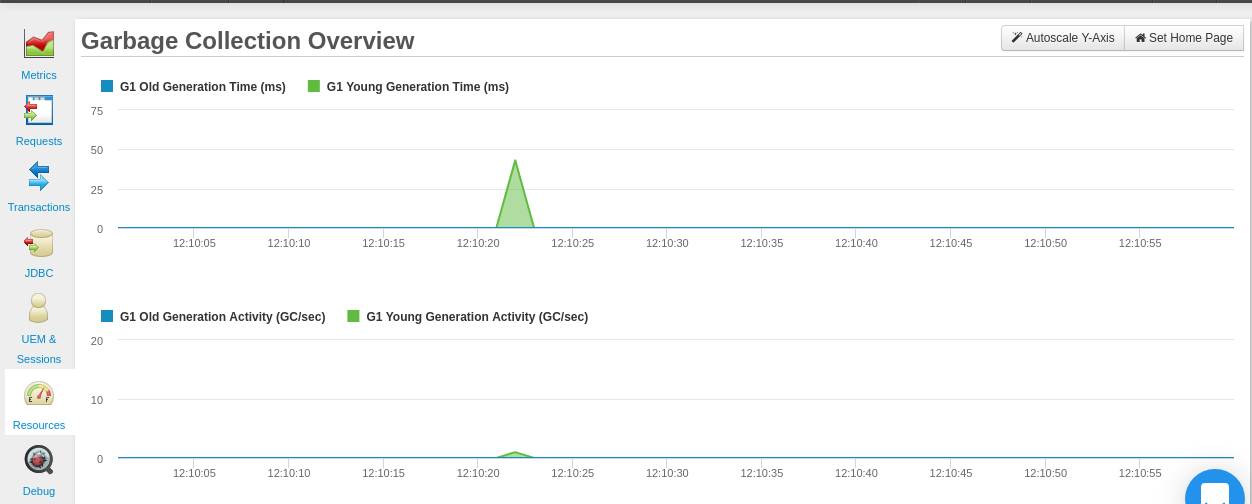
There are four garbage collectors that you can choose from while you observe the GC times from your FusionReactor dashboard:
- Serial Garbage Collector
- Parallel Garbage Collector
- G1 Garbage Collector
- and Z garbage collector
You can learn more about each garbage collector here and the criteria for choosing one.
Reduce Latency in Your Java Applications – Compaction
The heap memory may have objects allocated to it in a non-contiguous manner. This allocation may leave small spaces of free memory, causing fragmentation of the heap. If these free spaces are smaller than the minimum thread local area (TLA), then they can not be used for object allocation.
These small free spaces go unused until enough space is placed next to them during the next garbage collection.
Compaction serves as a way to bring objects together and leave a large space that can be used for object allocation. It achieves this by moving blocks of allocated memory to the lower end of the heap, thus leaving a large contiguous free space at the top.
It’s important to note that compaction happens during garbage collection. Therefore, having large chunks of memory to compact, will lead to long pause times. However, having little compaction will cause fragmentation & hence negatively impact your application’s performance.
Generally, the JVM does a good job at compaction. Although, if you notice periodic degradation in your application’s performance, then you can consider taking some action & observe what happens. Fluctuating values for throughput and response time for your application may be some of the smoking signals. Large garbage collections with long pauses should also be of interest to you.
You can tune your JVM for parallel compaction by turning on the -XX:+UseParallelOldGC flag. This will ensure that both minor and major collections are carried out in parallel, hence reducing the garbage collection overhead.
By default, major collections are carried out by a single thread, while minor collections are done using multiple threads. Therefore, using the -XX:+UseParallelOldGC should reduce the latency on a multiprocessor system.
Conclusion
This tutorial has shown you how you can use analytics from FusionReactor to monitor for high latencies and what measures you can take. Now it’s your turn to act! If you are new to FusionReactor, then you can start a free trial here, or take a look at how else FusionReactor Ultimate can help you find performance issues in your Java application.


