
In one of our previous blog post, we compared Java VisualVM with FusionReactor. Today we will look at alternatives to jstack and jcmd and compare features that jcmd and jstack provide against FusionReactor.
What is the difference between jcmd and jstack?
What is jstack?
Let’s start with jstack. According to Oracle’s documentation:
The jstack command-line utility attaches to the specified process or core file and prints the stack traces of all threads that are attached to the virtual machine, including Java threads and VM internal threads, and optionally native stack frames. The utility also performs deadlock detection. First, we need to mention that Java VisuaVM provides all the features available by jstack.
To make it simple, jstack is a terminal-based utility that prints the stack trace of the given JVM process. For example, in order to see stack traces of the Java program with PID 1302, you need to run the following command in the terminal jstack 1302. Here is the sample output that you can get from a running Spring-Boot application with embedded Tomcat
"http-nio-8080-exec-1" #23 daemon prio=5 os_prio=0 cpu=0.24ms elapsed=12.29s tid=0x00007f153cb0a800 nid=0x156fd waiting on condition [0x00007f14a60b1000]
java.lang.Thread.State: WAITING (parking)
at jdk.internal.misc.Unsafe.park(java.base@11.0.8/Native Method)
- parking to wait for <0x000000008e3e0e10> (a java.util.concurrent.locks.AbstractQueuedSynchronizer$ConditionObject)
at java.util.concurrent.locks.LockSupport.park(java.base@11.0.8/LockSupport.java:194)
at java.util.concurrent.locks.AbstractQueuedSynchronizer$ConditionObject.await(java.base@11.0.8/AbstractQueuedSynchronizer.java:2081)
at java.util.concurrent.LinkedBlockingQueue.take(java.base@11.0.8/LinkedBlockingQueue.java:433)
at org.apache.tomcat.util.threads.TaskQueue.take(TaskQueue.java:146)
at org.apache.tomcat.util.threads.TaskQueue.take(TaskQueue.java:33)
at org.apache.tomcat.util.threads.ThreadPoolExecutor.getTask(ThreadPoolExecutor.java:1114)
at org.apache.tomcat.util.threads.ThreadPoolExecutor.runWorker(ThreadPoolExecutor.java:1176)
at org.apache.tomcat.util.threads.ThreadPoolExecutor$Worker.run(ThreadPoolExecutor.java:659)
at org.apache.tomcat.util.threads.TaskThread$WrappingRunnable.run(TaskThread.java:61)
at java.lang.Thread.run(java.base@11.0.8/Thread.java:834)
As you can see, jstack shows us a Tomcat thread that is waiting for new requests.
jstack is available as a part of Oracle’s JDK since JDK 6. However, we have to mention that since JDK 8, Oracle wants to deprecate this utility. According to jstack official documentation:
The release of JDK 8 introduced Java Mission Control, Java Flight Recorder, and jcmd utility for diagnosing problems with JVM and Java applications. It is suggested to use the latest utility, jcmd instead Which means that for java versions starting from 8 and higher the jcmd should be used.
What is jcmd?
Now let’s briefly cover jcmd. According to the official documentation
The jcmd utility is used to send diagnostic command requests to the JVM, where these requests are useful for controlling Java Flight Recordings, troubleshoot, and diagnose JVM and Java Applications. jcmd is available as part of the JDK starting from version 8. It can do a lot more than jstack and is used as a general console based performance tracker tool for JVM. It is used in conjuction with events you are interested in. For example, in order to see the same stack traces as we got with jstack above , the following command must be used:
jcmd fusion-reactor.jar Thread.print. From now on , we will compare jcmd with FusionReactor because all jstack features are already available in jcmd.
Alternatives to jstack and jcmd. Comparing jstack and jcmd with FusionReactor
FusionReactor is a full-blown APM, but let’s keep the comparison fair
When considering alternatives to jstack and jcmd we want to emphasize that jcmd can only take statistics snapshots of the running JVM process which were available at the time of execution. On the other hand, FusionReactor is a complete monitoring tool that supports a huge range of monitoring options including Garbage Collector (GC), heap allocation, JDBC, Web performance, Live debugging, and a lot more. To be fair, we will only compare features that are available in both tools.
Console vs Web
The first big difference comes with the way both tools are launched. FusionReactor offers a web interface to monitor your JVM processes. The interface can be launched locally or through the Cloud in order to monitor remote processes in a production environment. On the other hand, jcmd can only be used within a terminal. Most people who get used to a great user experience offered by web or desktop apps won’t feel comfortable opening the terminal to monitor the performance of the underlying application. Moreover, jcmd can only get snapshots of the JVM processes that run on the same host which means that jcmd does not support remote processes. In order to use jcmd in production, the developer will have to have ssh access to the remote machine. However, with FusionReactor it’s a matter of opening your browser.
Troubleshooting Threads
As was shown above, jcmd (same as jstack) can print the stack traces of all threads running in the JVM with the following command jcmd: <process id/main class> Thread.print. For regular Servlet-based backends with a few hundred threads serving user requests, the output will be unreadable. Developers must rely on other utilities such as grep or awk in order to get the stack trace of the Servlet Thread they are interested in. In the production environment, most of our clients had ended up with a lot of bash scripts that present the output from jcmd in a human-readable form. Moreover, the output from jcmd gives you a stack trace as plain text. It has several problems. For example, you can’t tell for sure how much memory and CPU were used by the thread. The output from jcmd only shows you the total CPU, consequently, it doesn’t show which method in the call stack took most of the time. Another big issue with plain Strack traces is the user experience. In order to trace the issue, the developer will have to match the methods from the stack trace with the source code by constantly switching between the editor and the terminal. However, you won’t have any of these issues using FusionReactor.

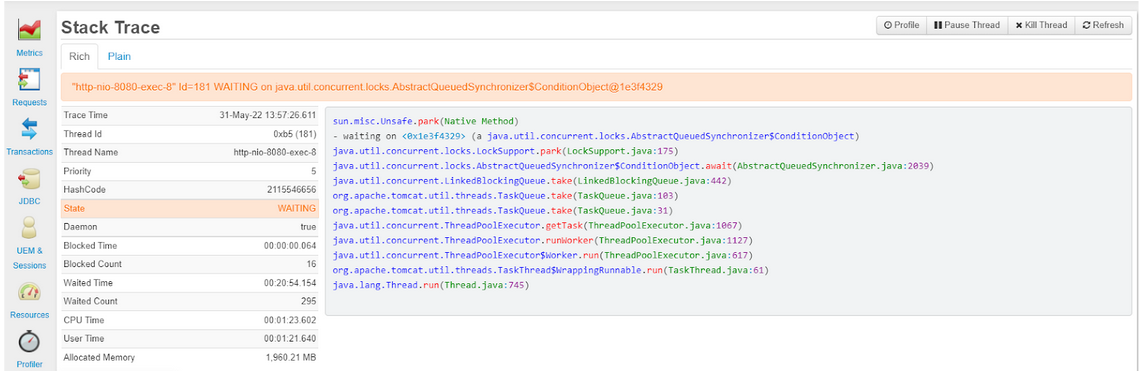
The interface offers a list of available threads with corresponding states (E.g RUNNABLE or WAITING). The built-in lookup functionality will allow you to filter threads by name or by state (you don’t need another utility for filtering). By clicking on the individual thread you will be redirected to the Thread information page that contains Stracktraces, the amount of CPU, and memory that this thread uses. Moreover, FusionReactor doesn’t show the stack trace as plain text, all stack traces are shown in the prettified format.
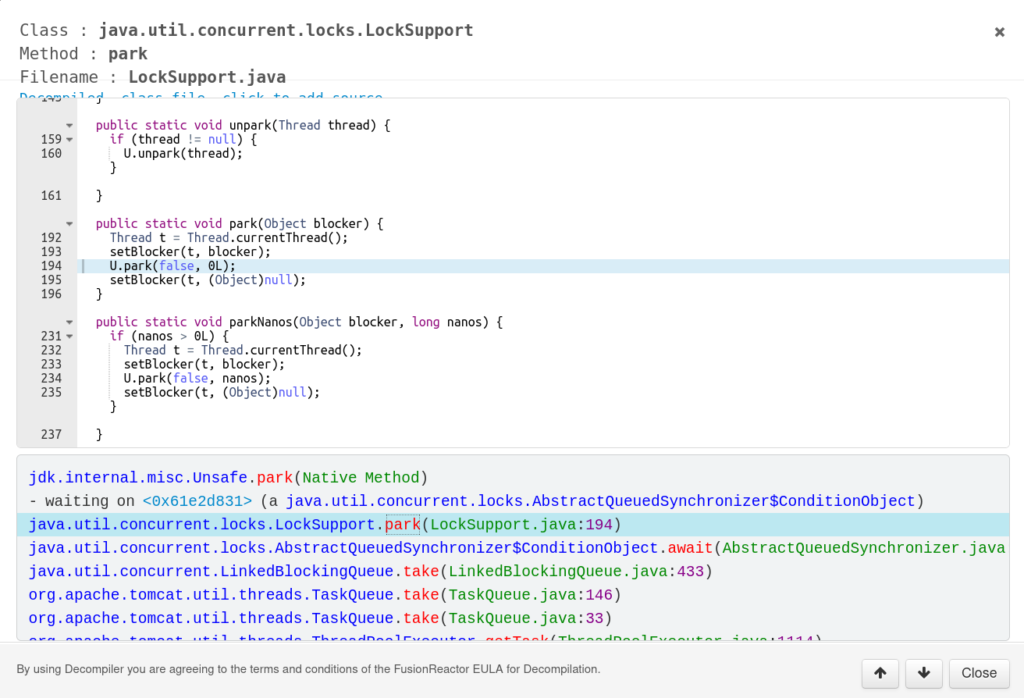
Each trace is clickable and redirects you to the decompiled source code (for example, here is the output that you get clicking at the park method from LockSupport class).
Apart from that, the dynamic nature of FusionReactor allows you to stop or pause the running thread (Unix doesn’t have a built-in utility to kill individual threads by ID). It can come in handy when a single Thread in production eats up all available CPU.
Heap troubleshooting
Heap is one of the main places to look at when you have production-level JVM problems such as long GC pauses or unreasonably big memory usage. jcmd supports heap statistics through the heap dumps.
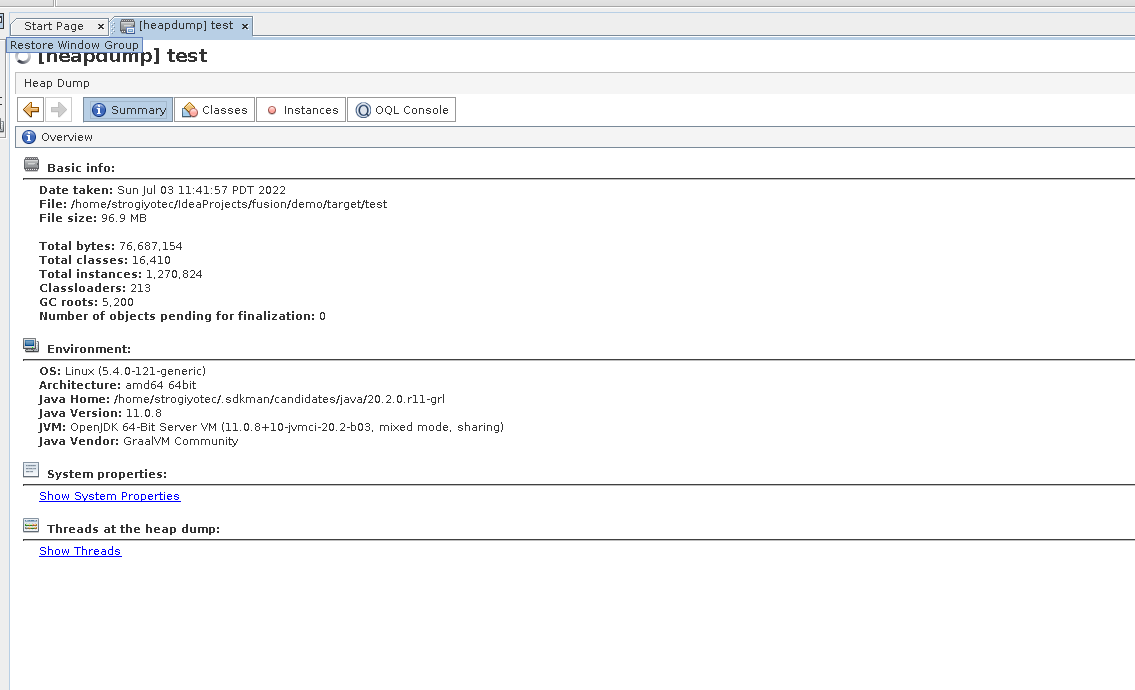
A heap dump is a snapshot of all the objects in the Java Virtual Machine (JVM) heap at a certain point in time To get a heapdump of the running process you can use the following command:
jcmd <pid> GC.heap_dump filename=Myheapdumpwhich will create a heap snapshot in the file named Myheapdump. After that you will have to use a separate software that can read heapdumps, the official one recommended by Oracle is Java VisualVM. These two steps are really cumbersome and take a lot of time. Moreover jcmd can only show heap insides on the time of the execution, previous heap statistics are not available.
With FusionReactor you have a memory profiler page that shows all memory spaces with corresponding graphs:
The above shows you the amount of total memory used and the Classes tab will show you how much memory was taken by each individual class.
These two steps are really cumbersome and take a lot of time. Moreover, jcmd can only show heap insides at the time of the execution, previous heap statistics are not available. Lastly, VisualVM can’t link the memory with GC Roots.
With FusionReactor you have a web page that shows all memory spaces with corresponding graphs.
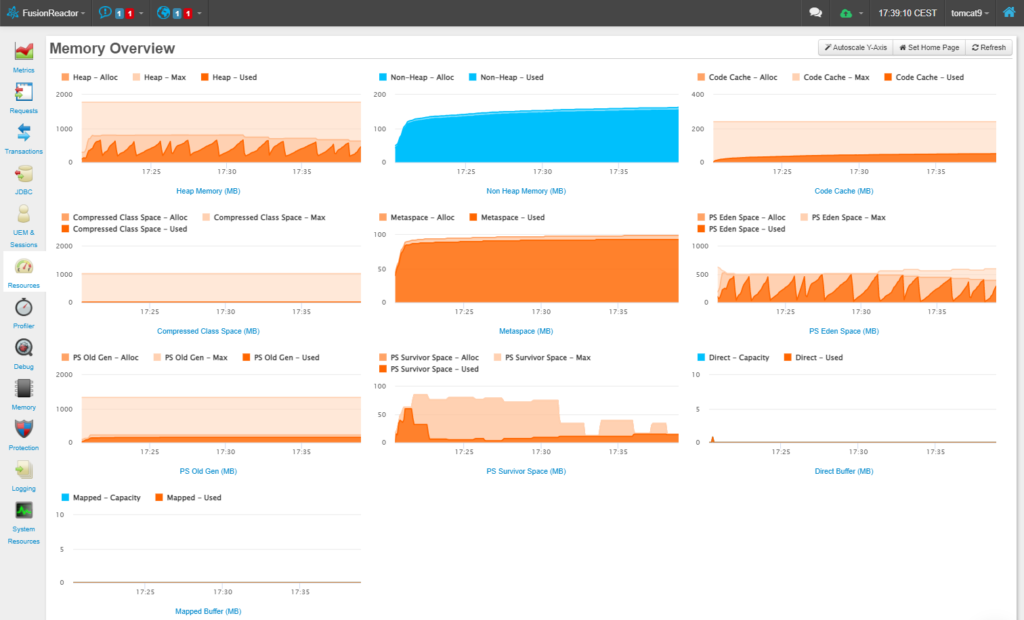
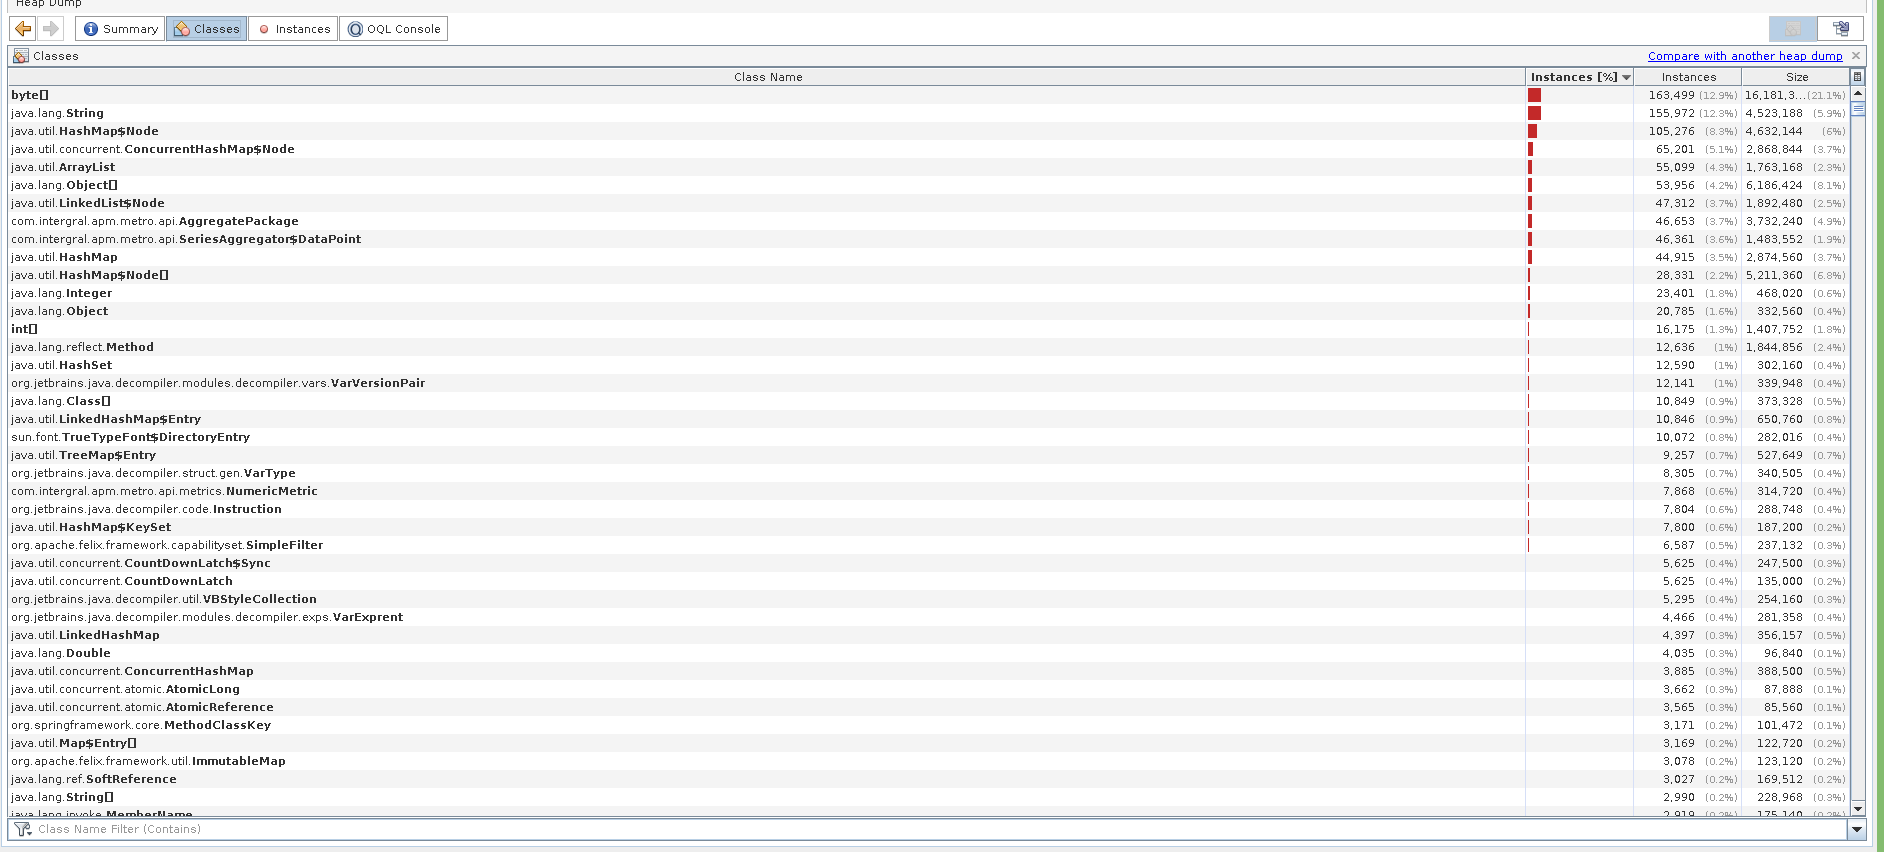
All memory metrics are recorded and persisted for future viewing. Apart from that, FusionReactor has a similar view to a VisualVM page that shows you the amount of memory per class (Go to Memory-> View Heap tab) As we can see, the byte array took 30% of the heap which doesn’t tell us much. The main advantage of FusionReactor is that it will link the memory with top-level classes. Click on the GC Roots button next to the class name to see which class created the byte arrays.
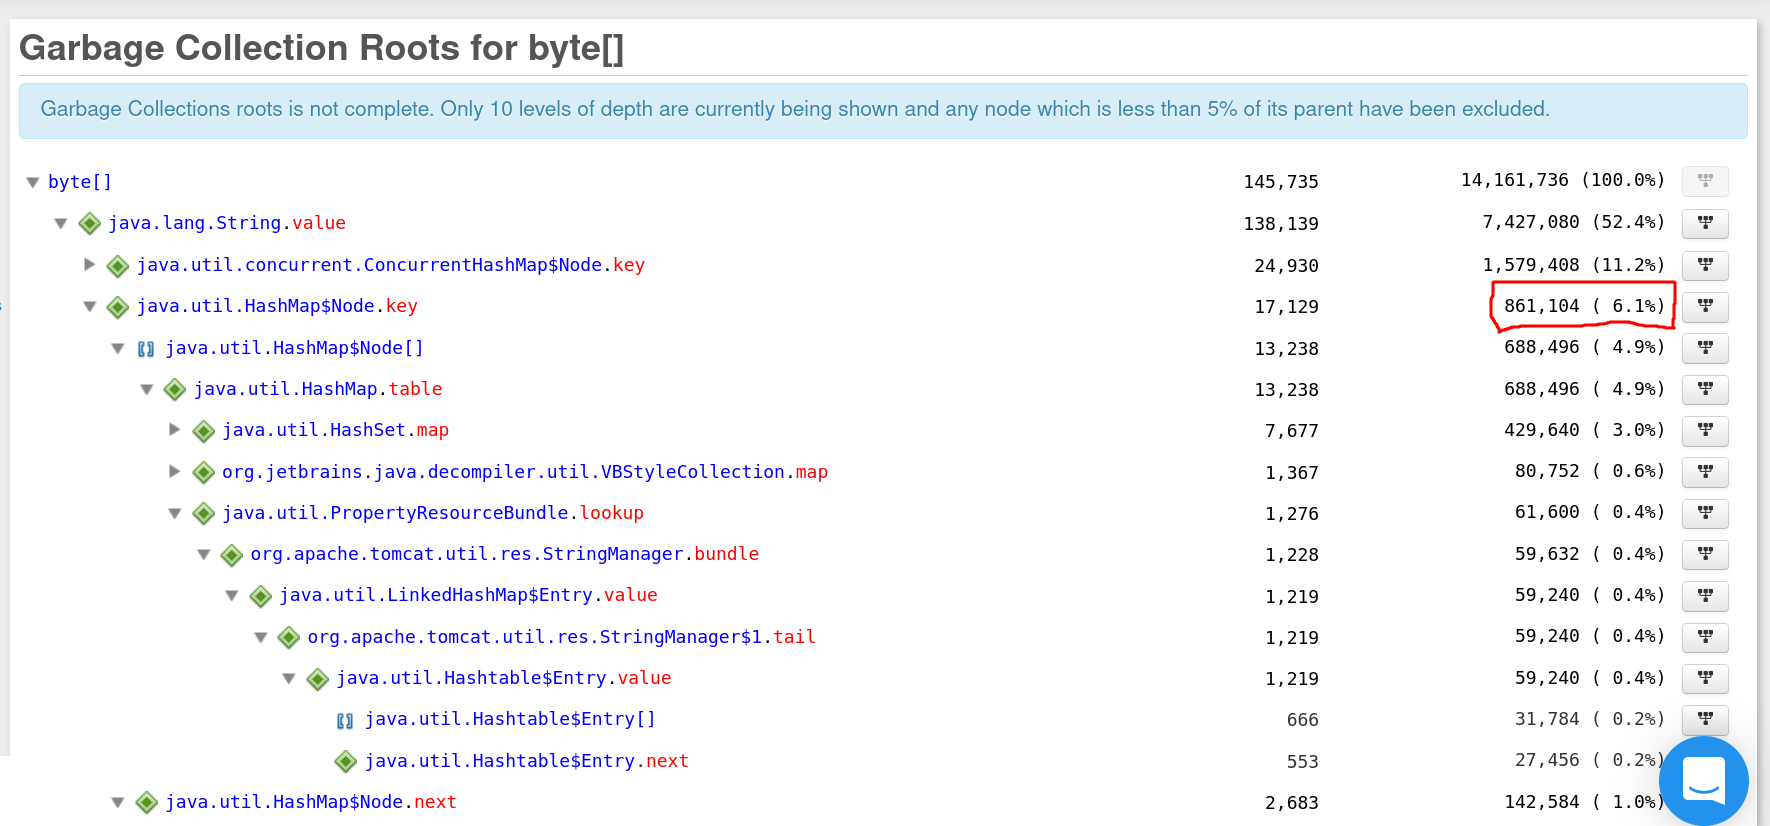
In the screen above we found that 6% of these byte arrays were created by Tomcat’s StringManager.
Troubleshooting using Java Flight Recorder
Java 8 introduced a new monitoring tool called Java Flight Recorder (JFR) which collects events from the running JVM process. Let’s say you want to understand why calling a specific REST endpoint eats up a lot of CPU time. In this case, the jcmd command can record events from the process and save them into the file. Here is the command to use: jcmd <pid> JFR.start name=MyRecording settings=profile duration=20s filename=myrecording.jfr. You can run this command which will collect events for 20 seconds, then call the endpoint, and then the jfr file will have all the events for this period of time. You will however need another tool to work with jfr files. The default one that comes with a JDK is a Java VisualVM.
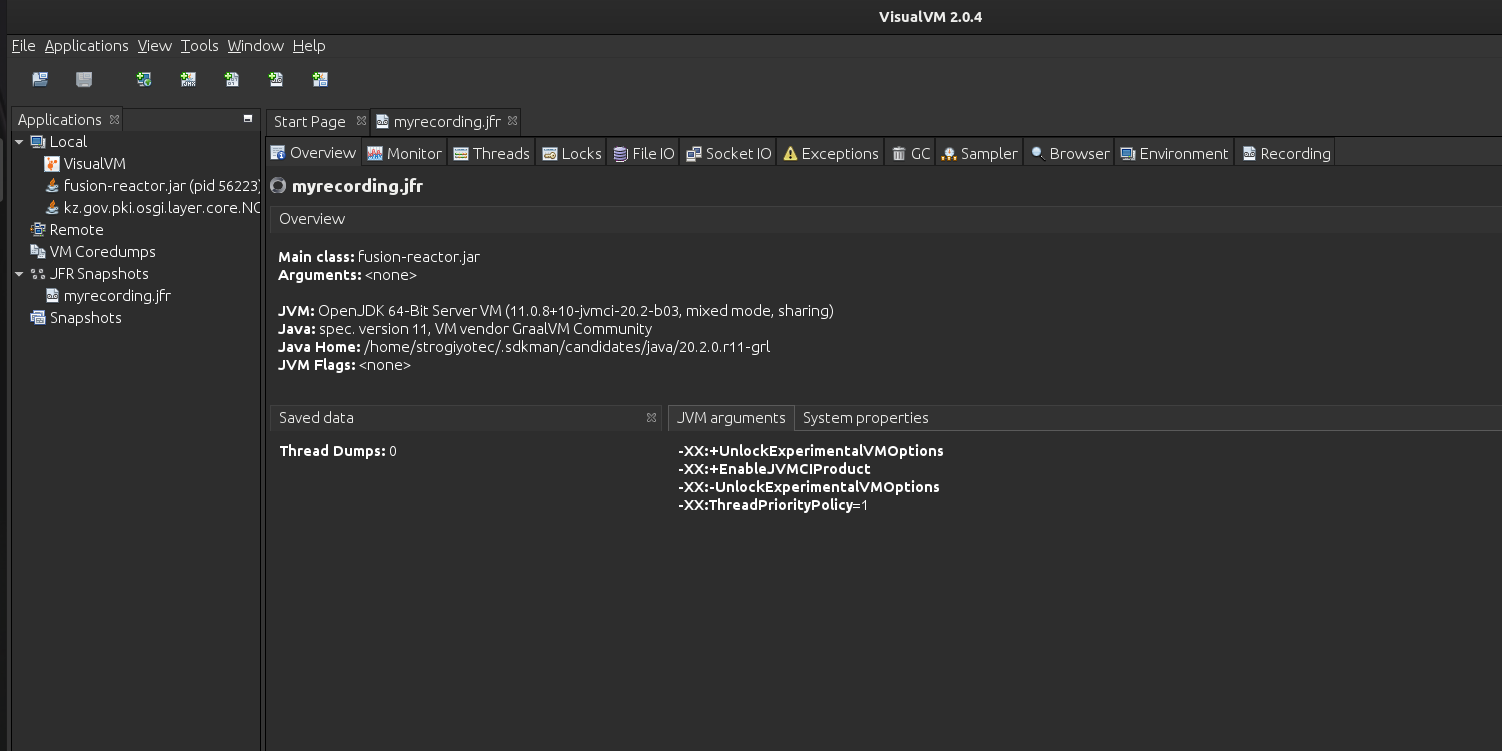
In the screen above you can see that JFR makes a great job gathering a lot of metrics about the Java process (Threads, Exceptions, GC, Locks, etc). The one big drawback here is that as with the heap, jcmd itself can only create a file that then has to be opened by a different program. Another issue is that you must run Fight Recorder to get the data from JVM, if a problem occurs without running Fight Recorder you won’t be able to understand what went wrong.
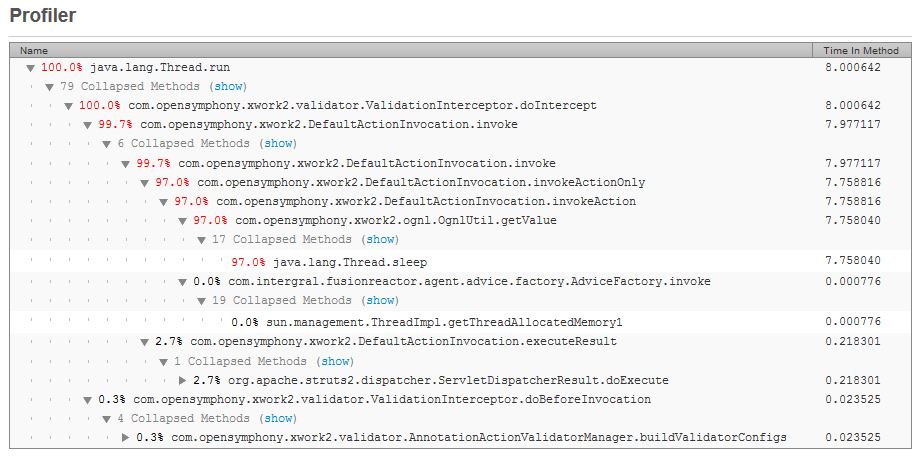
With FusionReactor, the application is constantly monitored, you don’t have to create jfr files and analyze them. If you have a CPU-related issue. In FusionReactor, you’ll find information on the thread that consumed the most CPU time, along with stack traces and timing info for each stack.
All application-level metrics are available in FusionReactor. For example here is the page (Requests->Response Codes) that shows all HTTP calls along with the request date, response codes, CPU time, and DB time. Each request has a corresponding Thread that you can click on to be redirected to the Strack Trace page that we discussed earlier.

Shell scripting
As jcmd is a command-line utility it can be used as part of a shell script. A developer might want to write a script that periodically runs jcmd to create heap dumps or make jfr snapshots. This gives the developer the flexibility of using a shell ecosystem. However, it requires the development team to support these scripts and integrate them with cloud providers. With FusionReactor all the monitoring use cases are already implemented. FusionReactor has an awesome plugin system that covers any additional needs. Most importantly, FusionReactor supports integration with the most popular cloud providers (such as AWS)
Comparing jstack and jcmd with FusionReactor, is FusionReactor right for you?
When looking for alternatives to jstack and jcmd, is FusionREactor a good choice? jcmd is a great tool for simple Java profiling that only covers the current state of the JVM. If you need a whole monitoring system that supports all the features offered in jcmd and more (Web performance, Live Debugging, System Monitoring) then consider trying FusionReactor.