
Diagnosing a server attack using logs
Imagine that your server is under attack. How would you diagnose the issue and understand its impact? You may have been aware of previous attacks and have seen significant spikes coming into your server. You could use your APM and look through metrics and individual transactions to diagnose the problem. But this would take some time.
There is an easier way to diagnose a server attack. The logs of both FusionReactor and the load balancer can give you the answer much quicker. And it is better for two reasons:
- Using the load balancer logs, we can go directly into the load balancer itself
- Having the summary information of the logs is more beneficial to us. The logs give us all the information in one place, not distributed across different transactions.
Using the log monitor
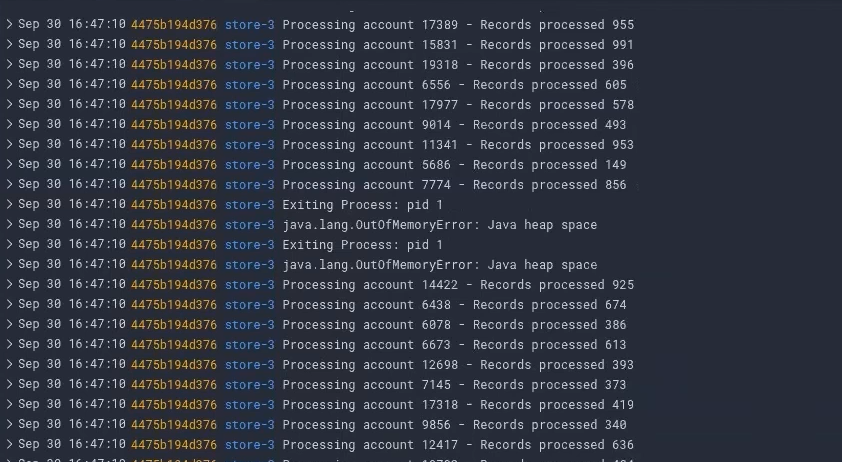
So when I go into the UX, you’ll see we have dashboards and events. I’m going to go to events and I’m going to look in my request logs. This is going to show me the request logs of all running FusionReactor instances right now.
Using LogQL to dig deeper into our logs
The LogQL query engine, which FusionReactor uses, allows us to run complex queries across your log files. Not only can LogQL show you the raw data from the logs, but it can also process that data. For example, if we wanted to look at all traffic by IP address, then we would run this query:
topk(10,sum by (clientAddress)(rate({filename="request"} | logfmt | line_format "{{.clientAddress}}" | __error__="" [1m])))
If you run this query in the UI, it’s going to take our request log, and it’s going to process these logs and give you a graph of the hits by IP address. However, we will need to filter out the IP address of the load balancer in order for this to give us useful data.
Removing the false positives
We would modify the query slightly, using the same syntax, but stripping out the load balancer IP:
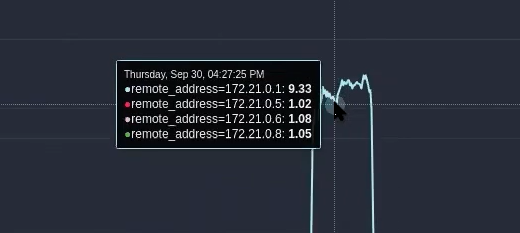
topk(10,sum by (remote_address)(rate({filename="/opt/access.log"} | logfmt | line_format "{{.remote_address}}" | __error__="" [1m])))
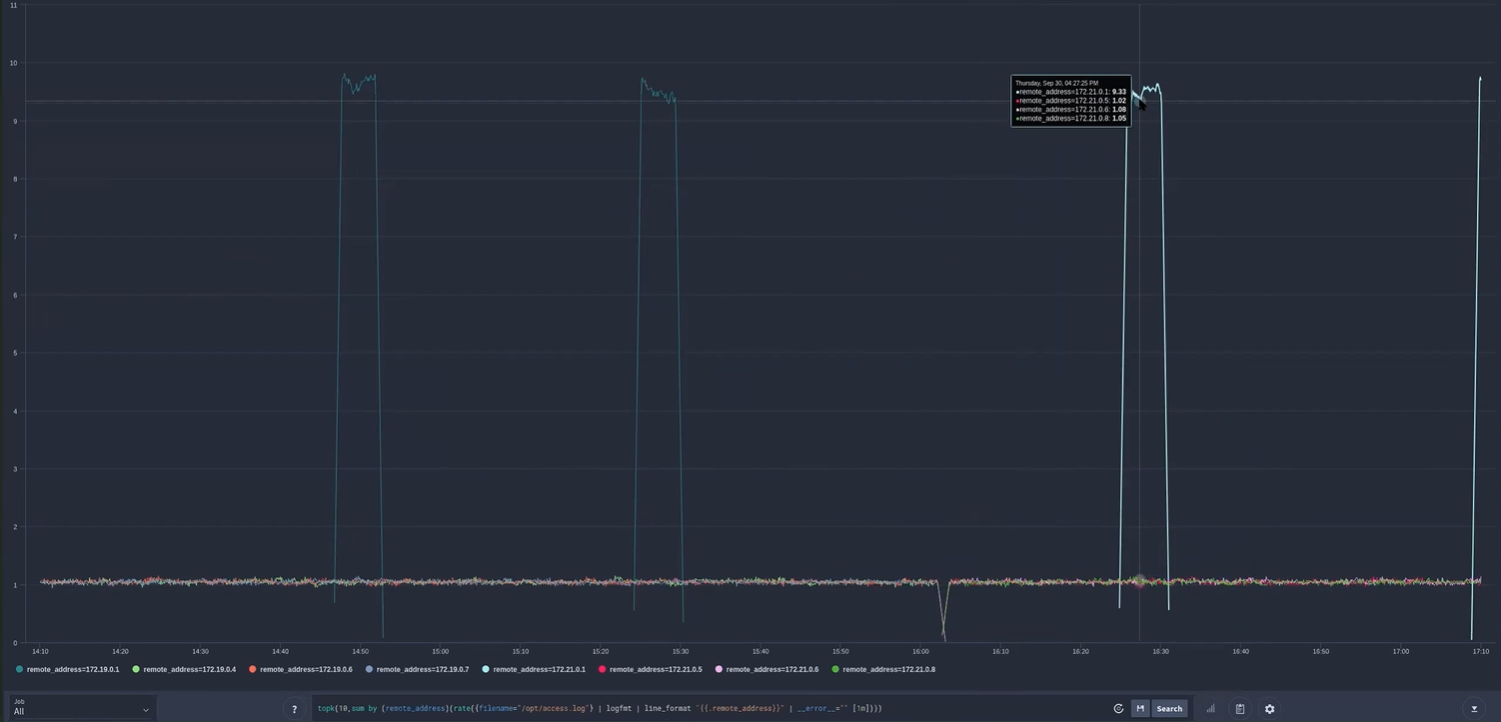
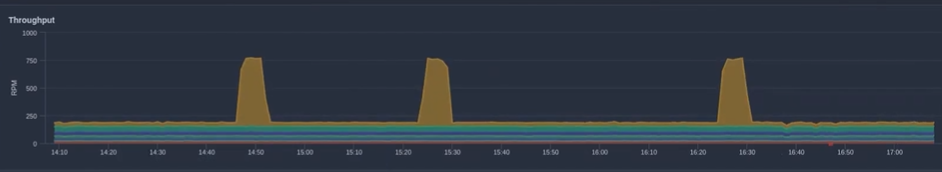
Now we can see the actual breakdown of IP addresses hitting my load balancer. As you can see here, we have three load balancer nodes firing, and then when we have an attack, we have a spike of traffic from a particular IP address. Watch this video, and you will see that an attack occurred during the recording.
Cleary see who is attacking your server
We can clearly see who is attacking our server. In this case, it is one machine attacking us, the attack is not a distributed attack. This tells us who it is, but what we need to know is what they are doing and precisely where they are doing it.
Understanding where the attack is taking place
This time we are going to query the request log and would run this query:
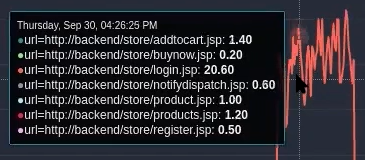
sum by (url)(rate({filename="request"} | logfmt | line_format "{{.url}}" | __error__="" [10s]))
This query tells us which pages are being hit during the attack. We are now building a picture; we know who’s attacking us, and we now know what they’re doing.
Understanding the nature of a server attack
Next, we need to understand the implications of the attack.
- Are they breaching us?
- Is the attack hurting performance?
- Is the application being degraded in any way?
I’m going to modify my query. So I’m going to set it so that my query processes the request log. And because I know the page, I’m going to do a broad text match on my exact URL:
{filename="request"} |= "login.jsp"
Use the time picker at the top to select the timeframe when we know the attack took place and we process the metrics in the logs. Therefore, we don’t have to read each one individually.
Assessing the damage
The field can be graphed. As a result, we can generate a graph by clicking the graphic on here, which displays the CPU time across requests. You can see here that there was a spike around a half-hour ago in server three. So when we’re under attack, we don’t seem to see any CPU spikes.

In the docs you will find other examples of how this could be used.
Understanding the server attack
So by using various logs and creating queries using LogQL we can very quickly find the source of the attack, the exact pages that were attacked, and understand any damage that needs repairing.