
Reasons for a server crash
Java can crash in several ways and for several reasons. Sometimes it’s not easy to diagnose a server crash. For example,
- Your JVM may still be operational, but you cannot process requests anymore.
- Part of your application breaks because of some resource limits, but some are still functional.
- Or, your application automatically restarts when it crashes; you don’t notice the crash because the app only takes a few seconds to restart. It’s almost an invisible issue.
It would be best if you did not ignore any of these issues, and you need to get to the root cause of the problem to prevent it from recurring or escalating.
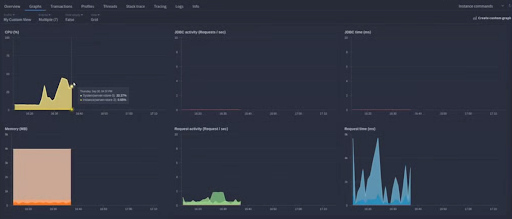
In the video example, something went wrong, and my JVM completely halted. I have now lost all metrics to my instance. If I go to my server, I can see a metric stop suddenly, but nothing happens to spur this metric stop. It just seemed suddenly to stop being operational. I can look at my transactions and can’t detect any errors.
Metrics and transactions don’t always help
So it’s hard to diagnose what happens from metrics and transactions alone. But in our APM, FusionReactor, I’m also sending my standard out and standard error logs to the Cloud. So this is where my Tomcat process is going to log any events.
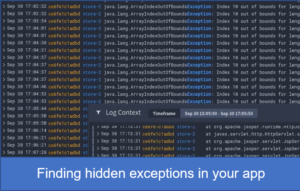
Logs are far more helpful
I’m going to look at my server events in my logs. First, I will run a query that interrogates the standard out log files. It’s a wildcard match that is looking for anything that begins store.
{ job=~"store-.*", filename=~"std.*" }
The results showed me the final logs before the crash of the instance.

As you can see here, we’ve got it was processing some account data, and this is a debug log I have on one of my pages. Then you have “heap space errors” and see that the process exited. So this is showing me the exact time when my server crashed.
Read more about what logs are and why you should monitor them.
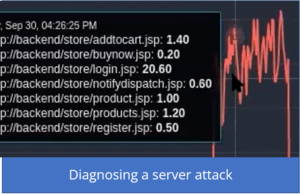
Logs let you dig deeper
We can then discover the exact page that the error fired and to do this we can process our request log.
{filename="request",job="store-3"} |= "reports.jsp"
On the video, you will see that we had various bits of traffic running in, and then you see a report that CFM is running, which we can see in the URL. So what we can confirm is when the crash is when the report ran. We can determine that the report appeared to have exhausted our heap somehow.
Logs will tell us if it’s a recurring error
To find out if this is a recurring issue, we can run a query that sees how often this error occurs. This query will tell us the number of occurrences for this out-of-memory error crashing my Java server.
sum by (job) (count_over_time({job=~"store-.*"} |= "java.lang.OutOfMemory" [1m]))
The video will show you how to manipulate the time picker, and we will see that this wasn’t a one-off occurrence. Unfortunately, finding memory issues is difficult to debug, but querying your logs using LogQL takes away much of the heavy lifting.
-
Discovering why your server crashed
Next, you could take a look at the reports page code itself and run some analysis to tell you:-
- If the code is particularly memory-intensive
- If you are storing large objects
Further steps
- You could also add further debug logs
- Consider turning on heap dump out of memory so that when your server does crash due to “out of memory,” you get a report [link to crash reporting] detailing why it crashed, and you can analyze that upon a future crash.
- Create an alert to notify you any time an OutOfMemory crash occurs
So that would help you to identify the cause of the server crash. And have some context as to why and what to do as further action.
Using logs to diagnose a server crash easily
Finding crashes can be difficult as some of them are practically invisible. Once you have found them, you need to go deep into your logs to discover where and why the crash occurred. Following our simple process will save you many hours. FusionReactor has all of the tools to enable you to do this, including: –