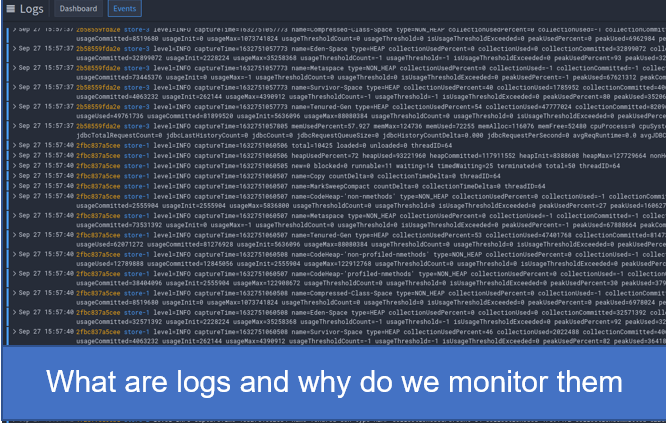
What are logs, and why do I need to monitor them?
Let’s start by clarifying the basics. Logs are recordings of events that have taken place while an application runs. Some are automatically created, and some are explicitly developed – for example, when we debug. The application, process, server, or container will all create many logs
What is logging used for?
The point of a log file is to keep track of what’s happening behind the scenes. For example, if something should happen within a complex system, you have access to a detailed list of events before and during the malfunction.
Why use a log monitor?
Systems within an organization will create huge volumes of data. The purpose of a log monitor is to provide insight by ingesting them and then giving you the tools to: –
- Store
- Compare
- Visualize
- Graph
- Analyze
- And alert you when things go wrong.
Deep insight into what went wrong so you can fix it
- A log monitoring tool enables you to interrogate your logs using a query language such as LogQL. The resulting query will tell you why an event such as an error or outage occurred. Monitoring logs will allow you to compare logs from different sources to build a complete picture.
- Visualization tools will help you make better sense of the raw data; graphs are often easier to interpret and spot trends.
- Log monitoring can help protect you, allowing you to see things like substantial request rates, which could mean a server attack.
- Traditional debugging uses logs to give you the extra context. In fact, tools like FusionReactor’s patented production debugger creates log files to allow you to find exceptions in production. Automated route cause analysis tools such as FusionReactors Event Snapshot creates logs that enable it to take the user to the precise thread that an error fired on. Logs can help you find errors that you didn’t know you had, errors that aren’t usually picked up by your monitor, such as handled errors within a try-catch block that hides the actual error for the end-user.
Powerful dashboards and alerting
You can explore logs manually, but dashboards allow you to create dynamic views that give you a summary of application health based on log data. You can then drill down into log content from the dashboard to find the root cause of an issue.
You can use logs as an alert engine. You create queries alerts for different scenarios such as
- Event-based alerts that inform you when a specific event occurs
- Rate-based alerting looks for rises or falls in
- Value-based alerts
- Comparative alerts from log content
Your log alert engine will continually monitor your log files until a condition is met and then alert you to your preferred channel.
With all that power comes responsibility
Once installed, FusionReactor gives you instant access to deep insight. Its out-of-the-box configurations make using it simple.
Things change slightly with log monitoring because FusionReactor will ingest any log you throw at it. Consequently, you can add logs from any system into FR: developer, SRE, DevOps, Sales, Finance, literally anything. So you get to choose which logs you send to us to monitor.
No standards
Logging is a little more tricky; there is no standard for logs, different organizations use different formats, so making sense of them can be challenging. For example, a pattern parser allows you to convert log lines into more contextual data.
Distributed systems
Trying to tie logs from distributed systems together is a nightmare and could make triage times longer, the opposite of what you need. Using logical and well-structured labels allows you to create well-linked logs.
Security and privacy issues
Logs can contain confidential or financial data such as payment information, card numbers, or passwords and cause you privacy or security issues. Obfuscating logs allows you to keep everyone safe and compliant.


