
Instrumenting OTel
What is OpenTelemetry?
OpenTelemetry is an open-source observability framework that aims to make it easier to instrument, generate, collect, and export telemetry data from software applications and systems. It provides a set of standard APIs, libraries, and agents that can be used to collect and transmit telemetry data, including metrics, traces, and logs, from different sources and across different environments.
OpenTelemetry aims to provide a vendor-neutral, community-driven solution that simplifies the instrumentation and observability of modern distributed systems. It aims to eliminate the need for developers and operators to use multiple proprietary tools and APIs to gather and analyze telemetry data from different parts of their applications and infrastructure.
Instrumenting OpenTelemetry
OpenTelemetry enables tracing, metrics, and logging telemetry through single-distribution multi-language libraries and tools that allow for a plug-and-play telemetry architecture that includes the concept of agents and collectors.
Setting up OpenTelemetry to ingest data into the FusionReactor Cloud is a simple procedure that will only take a few minutes. It provides additional insight into your product and the metrics it produces, so you can quickly investigate and pinpoint issues.
Procedure
The following step-by-step guide demonstrates how to use OpenTelemetry to send data to the FusionReactor Cloud.
The example below uses Docker, and a simple Go App based on the OpenTelemetry Go Github project.
Initialize OpenTelemetry
To configure the app to send telemetry data, you need a function to initialize OpenTelemetry.
Step 1: Add the code
Add the following code in the main.go file under **import** to add the required dependencies for the project.
import (
"context"
"fmt"
"time"
"log"
"go.opentelemetry.io/otel"
"go.opentelemetry.io/otel/attribute"
"go.opentelemetry.io/otel/exporters/otlp/otlptrace/otlptracehttp"
"go.opentelemetry.io/otel/exporters/otlp/otlpmetric/otlpmetrichttp"
"go.opentelemetry.io/otel/sdk/resource"
sdkmetric "go.opentelemetry.io/otel/sdk/metric"
sdktrace "go.opentelemetry.io/otel/sdk/trace"
semconv "go.opentelemetry.io/otel/semconv/v1.17.0"
"go.opentelemetry.io/otel/trace"
"go.opentelemetry.io/otel/metric"
"go.opentelemetry.io/otel/metric/global"
"go.opentelemetry.io/otel/propagation"
"go.opentelemetry.io/otel/metric/instrument"
)
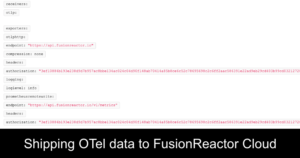
Step 2: Add the variable to define endpoint
Add a variable to define the Otel collector endpoint. The example below uses Docker containers, so the address uses the docker container name of the Otel collector (otelcollector:4318), instead of localhost
var (
endpoint = "otelcollector:4318"
tracer trace.Tracer
serviceName = "test-go-server-http"
serviceVersion = "0.1.0"
lsEnvironment = "dev"
meter = global.MeterProvider()
)
Add two functions
Add two functions to the project – one to set up metrics, the other to set up traces.
func setupMetrics(ctx context.Context) (*sdkmetric.MeterProvider, error) {
exporter, err := otlpmetrichttp.New(
ctx,
otlpmetrichttp.WithInsecure(),
otlpmetrichttp.WithEndpoint(endpoint),
)
if err != nil {
return nil, err
}
// labels/tags/resources that are common to all metrics.
resource :=
resource.NewWithAttributes(
semconv.SchemaURL,
semconv.ServiceNameKey.String(serviceName),
semconv.ServiceVersionKey.String(serviceVersion),
attribute.String("environment", lsEnvironment),
attribute.String("test-attribute", "test-value"),
)
mp := sdkmetric.NewMeterProvider(
sdkmetric.WithResource(resource),
sdkmetric.WithReader(
// collects and exports metric data every 5 seconds.
sdkmetric.NewPeriodicReader(exporter, sdkmetric.WithInterval(1*time.Second)),
),
)
global.SetMeterProvider(mp)
return mp, nil
}
func setupTracing(ctx context.Context) (*sdktrace.TracerProvider, error) {
exporter, err := otlptracehttp.New(
ctx,
otlptracehttp.WithInsecure(),
otlptracehttp.WithEndpoint(endpoint),
)
if err != nil {
return nil, err
}
resource :=
resource.NewWithAttributes(
semconv.SchemaURL,
semconv.ServiceNameKey.String(serviceName),
semconv.ServiceVersionKey.String(serviceVersion),
attribute.String("environment", lsEnvironment),
)
tp := sdktrace.NewTracerProvider(
sdktrace.WithBatcher(exporter),
sdktrace.WithResource(resource),
)
otel.SetTracerProvider(tp)
otel.SetTextMapPropagator(
propagation.NewCompositeTextMapPropagator(
propagation.TraceContext{},
propagation.Baggage{},
),
)
return tp, nil
Step 1: Create a new exporter
Create a new exporter to send trace or metric data to the collector previously defined as otelcollector on port 4318.
The above procedure uses no security. It is recommended to use something like Mutual TLS.
Step 2: Create a provider
Create a provider to give more information about what is happening for a given operation, such as a specific metric or trace span.
Step 3: Set propagator for tracing
Set a propagator for tracing. Propagation is the mechanism by which a trace can be disseminated and communicated from one service to another across transport boundaries.
Step 4: Initialize the metric & trace exporters
Under the main function, add the following to initialize the metric and trace exporters. The attributes here are just example key-value descriptors that you can manually set for your trace:
func main() {
log.Printf("Waiting for connection...")
ctx := context.Background()
//metrics
{
mp, err := setupMetrics(ctx)
if err != nil {
panic(err)
}
defer mp.Shutdown(ctx)
}
//traces
{
tp, err := setupTracing(ctx)
if err != nil {
panic(err)
}
defer tp.Shutdown(ctx)
}
tracer = otel.Tracer(serviceName, trace.WithInstrumentationVersion(serviceVersion))
tracer := otel.Tracer("test-tracer")
// Attributes represent additional key-value descriptors that can be bound
// to a metric observer or recorder.
commonTraceAttrs := []attribute.KeyValue{
attribute.String("attrAtrace", "test1.1"),
attribute.String("attrBtrace", "test2"),
attribute.String("attrCtrace", "test3"),
}
//trace starts
ctx, span := tracer.Start(
ctx,
"CollectorExporter-Example",
trace.WithAttributes(commonTraceAttrs...),
)
defer span.End()
//example counter metric
counter, _ := global.MeterProvider().
Meter(
serviceName,
metric.WithInstrumentationVersion("0.0.1"),
).
Int64Counter(
"add_counter",
instrument.WithDescription("how many times addCounter function has been called."),
)
for i := 1; i < 30; i++ {
_, iSpan := tracer.Start(ctx, fmt.Sprintf("Sample-%d", i))
log.Printf("Doing really hard work (%d / 30)\n", i+1)
counter.Add(
ctx,
1,
attribute.String("type", "add"),
)
<-time.After(time.Second)
iSpan.End()
}
log.Printf("Done!")
The main function calls the setup functions, then creates a trace that runs for 30 seconds and a counter metric that increments each second.
Step 5: Create Docker containers
In your Go project’s directory, create the Dockerfile with the following code. This creates the Go Docker image, sets the traces and metrics endpoint for OTEL to point to our collector docker container, and tells this image to start our Go file:
FROM golang
WORKDIR /app
COPY go.mod go.sum ./
RUN go mod download && go mod verify
COPY *.go ./
RUN go build -o /gooteldemoENV OTEL_EXPORTER_OTLP_TRACES_ENDPOINT=http://otelcollector:4318/v1/traces
ENV OTEL_EXPORTER_OTLP_METRICS_ENDPOINT=http://otelcollector:4318/v1/metrics
ENV OTEL_SERVICE_NAME=gooteldemo
ENV OTEL_RESOURCE_ATTRIBUTES="application=gooteldemo"
CMD ["/gooteldemo"]
Setting up OpenTelemetry to ingest data into the FusionReactor Cloud is a simple procedure that will only take a few minutes. It provides additional insight into your product and the metrics it produces, so you can quickly investigate and pinpoint issues.