
Shipping OpenTelemetry data with FusionReactor Cloud
What is OpenTelemetry?
OpenTelemetry is a powerful open-source observability framework that enables developers to collect, analyze, and export telemetry data from their applications and systems.
One of the key benefits of using OpenTelemetry is the ability to easily ship telemetry data to various destinations, including monitoring and analysis platforms.
In this blog post, we’ll explore the benefits of shipping OpenTelemetry data to FusionReactor and how it can help developers and operations teams better understand and optimize their applications.
Benefits of shipping telemetry data
Improved observability
Shipping OpenTelemetry data enables developers to gain better visibility into their applications and systems. By collecting and exporting telemetry data, developers can quickly identify issues and bottlenecks in their code and infrastructure. This enables them to take corrective action before these issues become critical, improving application performance and reducing downtime.
Enhanced troubleshooting
OpenTelemetry data can be shipped to a variety of destinations, including monitoring and analysis platforms, where it can be analyzed in real-time. This allows developers and operations teams to troubleshoot issues and identify the root cause of problems quickly. With detailed telemetry data, they can pinpoint the exact line of code or system component causing the issue, reducing the time and effort required to fix it.
Optimized performance
By collecting and shipping telemetry data, developers can identify performance issues and optimize their applications for better efficiency. With detailed performance metrics, developers can identify bottlenecks and optimize code to reduce response times and improve overall application performance. This can result in a better user experience and reduced infrastructure costs, as applications require fewer resources to run.
Easy integration
OpenTelemetry is designed to be highly extensible and easily integrated with a wide range of applications and systems. This makes it easy for developers to ship telemetry data to their preferred destinations, including monitoring and analysis platforms. With OpenTelemetry, developers can choose from a wide range of exporters, including Jaeger, Prometheus, and Zipkin, to name a few.
Standardization
OpenTelemetry provides a standardized format for telemetry data, making it easy for developers to export data to a wide range of destinations. This standardization ensures that data is easily consumed by monitoring and analysis platforms, reducing the need for custom integrations and simplifying the overall monitoring process.
How to ship data to FusionReactor
OpenTelemetry is a powerful tool to pull metrics and traces from your servers, and this is just one example of the many implementations to use OpenTelemetry with FusionReactor.
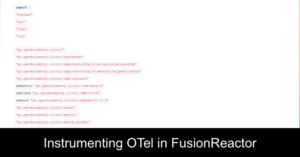
Step 1: Create an otel-config.yaml file
For our OTel Collector, we need to create an otel-config.yaml file.
💡 Tip: Be careful with the indentation here, as yaml syntax is very sensitive.
receivers:
otlp:

exporters:
  otlphttp:
    endpoint: "https://api.fusionreactor.io"
    compression: none
    headers:
      authorization: "3ef10884b193e238d9d7b957ac8bbe134ac024c04d90f148ab70414a85b8ce6c52c78695698c2c6ff2aac586391e22ad9eb29cd403b99cd03212720df37cd6d8"
  logging:
    loglevel: info
  prometheusremotewrite:
    endpoint: "https://api.fusionreactor.io/v1/metrics"
    headers:
      authorization: "3ef10884b193e238d9d7b957ac8bbe134ac024c04d90f148ab70414a85b8ce6c52c78695698c2c6ff2aac586391e22ad9eb29cd403b99cd03212720df37cd6d8"

services:
  pipelines:
    metrics:
      receivers: [otlp]
      exporters: [prometheusremotewrite]
    traces:
      receivers: [otlp]
      exporters: [otlphttp]
The receivers section declares that all telemetry data will be sent to the OTel collector’s receiver running on otelcollector port 4318, using OpenTelemetry Protocol (OTLP) and HTTP format.
💡 Tip: You can use gRPC instead of HTTP.
Step 2: Configure OTLPHTTP and Prometheus remote_write
Next we configure our OTLPHTTP exporter for traces, and the Prometheus remote_write for metrics. The collector sends the metric and tracing data to the endpoints – the FusionReactor Cloud – at the address api.fusionreactor.io.
Step 3: Replace credentials with API key
Replace both credentials under Authorization here with your own API key.
💡 Tip: To generate a new API key, go to FusionReactor Cloud > Account Settings > API Keys > Generate. Copy this key and paste it under credentials.
Step 4: Services outlined and data shipped
Finally, in the services section is where we bring everything together.
pipelines:
  metrics:
    receivers: [otlp]
    exporters: [prometheusremotewrite]
  traces:
    receivers: [otlp]
    exporters: [otlphttp]
The above example states that:
- The OTLP receiver will receive metrics and traces.
- Metrics are then exported via Prometheus remote_write.
- Traces are exported via the OTLPHTTP exporter.
All of the data is then shipped to the FusionReactor Cloud.
Step 5: Create OTel Docker image
Use this config file to create an OTel Docker image and input the following:
FROM otel/opentelemetry-collector
ADD otel-config.yaml /etc/otelcol/config.yaml
Step 6: Create docker-compose.yml file
Create a docker-compose.yml file with the following to start your Go App and your OTel Collector.
services:
  gooteldemo:
    image: gooteldemo
    environment:
       - OTEL_SERVICE_NAME=gooteldemo
      - OTEL_RESOURCE_ATTRIBUTES="application=gooteldemo"

#otel
  otelcollector:
    image: gootelcollector
    ports:
      - "4318:4318"
      - "8888:8888"
Step 7: Run “docker-compose up”
Run “docker-compose up” in the terminal to bring up your containers, starting the Go App and Telemetry collection.
View your metrics and traces
Navigate to FusionReactor Cloud in a browser to access the many features available, such as Dashboards, which gives you loads to get started with without needing any additional configuration.
💡 Tip: Select Explore > Metrics in the drop-down. Then select the Metrics browser drop-down to see the Add Counter metric that was created in the above example. Selecting Use Query will display metric information graphically.
You can view the trace set up in the Go App, under Explore > Traces. Select Search and choose your Service Name eg test-go-server-http. Then select Run Query and your trace will be displayed.
Shipping OpenTelemetry data with FusionReactor Cloud
In conclusion, shipping OpenTelemetry with FusionReactor data offers a range of benefits for developers and operations teams. By providing improved observability, enhanced troubleshooting, optimized performance, easy integration, and standardization, OpenTelemetry makes it easy for developers to gain insight into their applications and systems, ensuring that they run smoothly and efficiently. As such, it is an essential tool for any modern software development team.