
Building poor Java performance scripts can generate lots of negative results in the long run. This includes page load delays resulting in frustrated page visitors and reduction in sales conversions, including several other effects. However, in this post, we’ll look at fast and effective ways to identify and fix application performance issues.
We’ve carefully outlined a production-grade APM solution designed for developers.
Profiling With FusionReactor To Find Application Performance Issues
With FusionReactor, you can quickly identify and fix performance issues. Profiling offers you a low-level insight that quickly isolates slow requests, threads, heap memory, and CPU usage problems.
The transaction profiler automatically profiles slow-running transactions, giving you an overview of the most time-consuming events by taking continuous lightweight samples. This gesture makes it possible to quickly spot locks and performance issues in application codes, java codes, frameworks, or the java engine itself and waiting on external resources such as DB, HTTP, or other external calls.
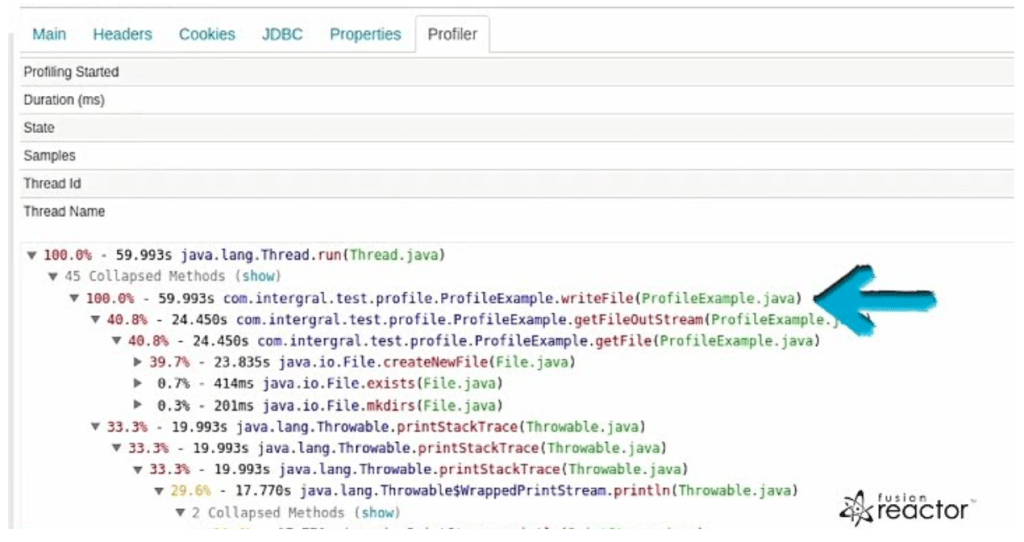
From the image above, this particular request spent all its time creating and writing to a file, which can be inefficient in Java.
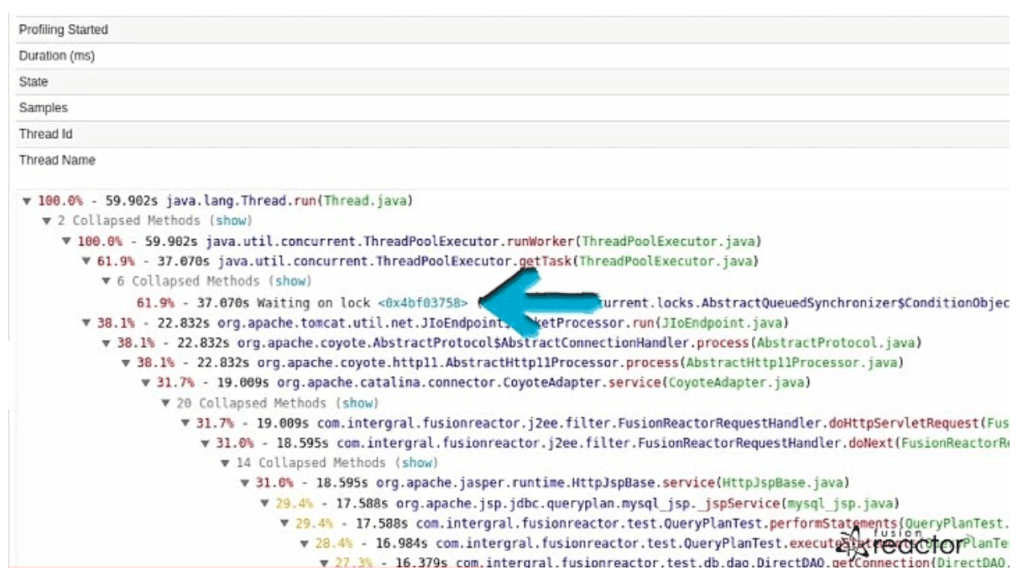
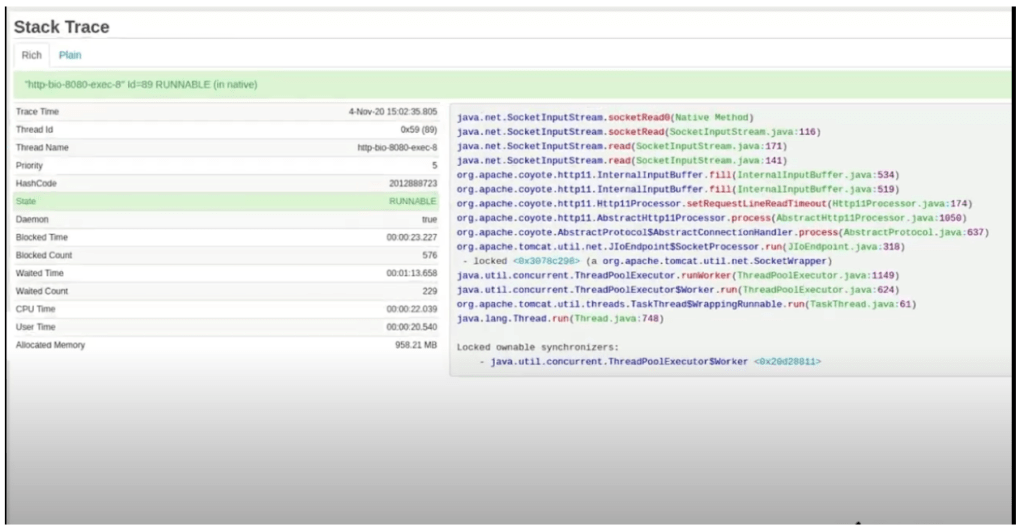
With FusionReactor’s thread profiler, you can profile running threads on-demand to overview what a thread is executing if something is blocking the thread. This could be something such as a lock or background task.
Below we can see another thread waiting for a task for about 60% of the time and expecting a request with JDBC the rest of the time.
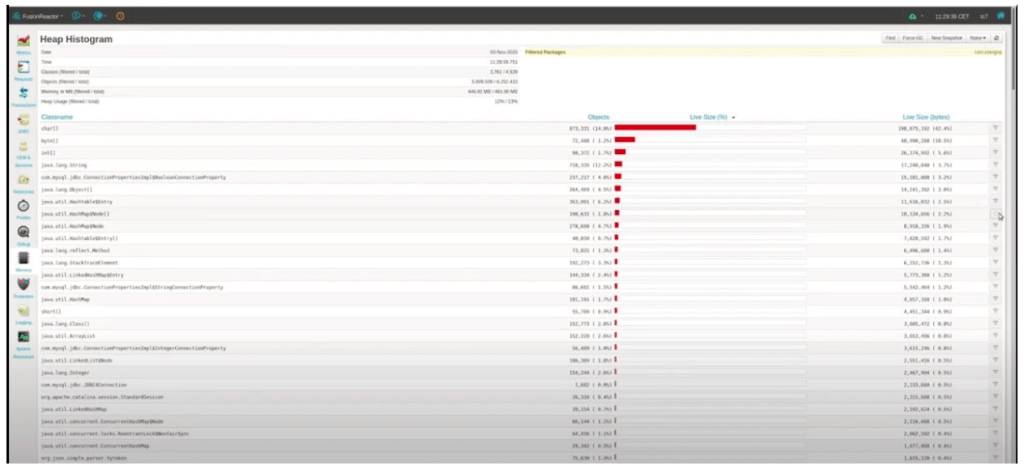
The final profiler is the memory profiler which allows you to see which objects are consuming space in a heap to spot large objects or potential memory leaks.
Individuals can be inspected to see garbage collection routes, and snapshots can be taken to assess performance over time. Profilers in FusionReactor offer features to improve performance throughout your application. This includes JVM resources, background processes, and individual requests.
Using FusionReactor To Isolate Code Performance Problems
The code profiling feature is available both on FusionReactor alternate and FusionReactor developer edition. The profiler can easily spot performance issues on your code. FusionReactor profile is very low overhead because it profiles by sampling. Each sampling takes about one millisecond. Typically, for a transaction that runs 3-4 seconds, we’ll have at least 5-6 samples. This makes the overhead very tiny. Each profile shows you the time spent within each method and the percentage of total time. With this, it is possible to spot issues and decompile the code in one click.
Locate Performance Bottlenecks in Memory and Heap Through
Continuous Memory and GC Profiling
Easily detect leakage in memory and optimize its usage while receiving constant and instant insight into the heap in your production Java applications with a low overhead memory profiler.
Garbage Collector
FusionReactor gives a drop-down, and detailed info about the configured garbage collector your JVM utilizes. It also shows the size of memory being freed and how often.
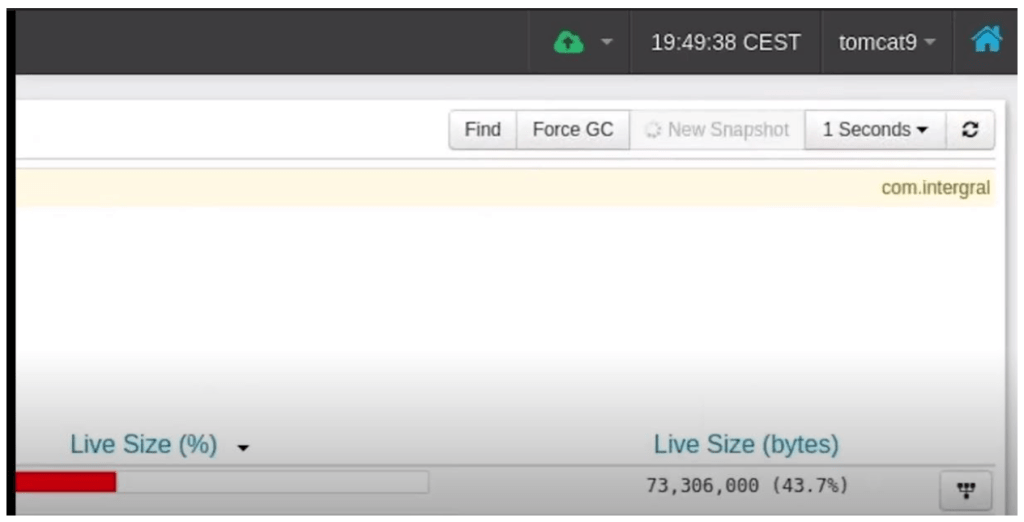
Low-Level Memory Profiling
Explore the inner view of the heap in real-time. Here, bytes are allocated and displayed as graphs indicating the percentage of bytes and the total number of bytes allocated by each class. Notably, objects are expressed as absolute numbers and as a percentage.
Compare Head Snapshots
Spot memory issues with ease by taking shots of the heaps, then saving them locally. This can be done by using the memory profiler. A memory snapshot captures profiling data on allocated objects. Snapshots can then be compared with their differences highlighted to analyze memory usage.
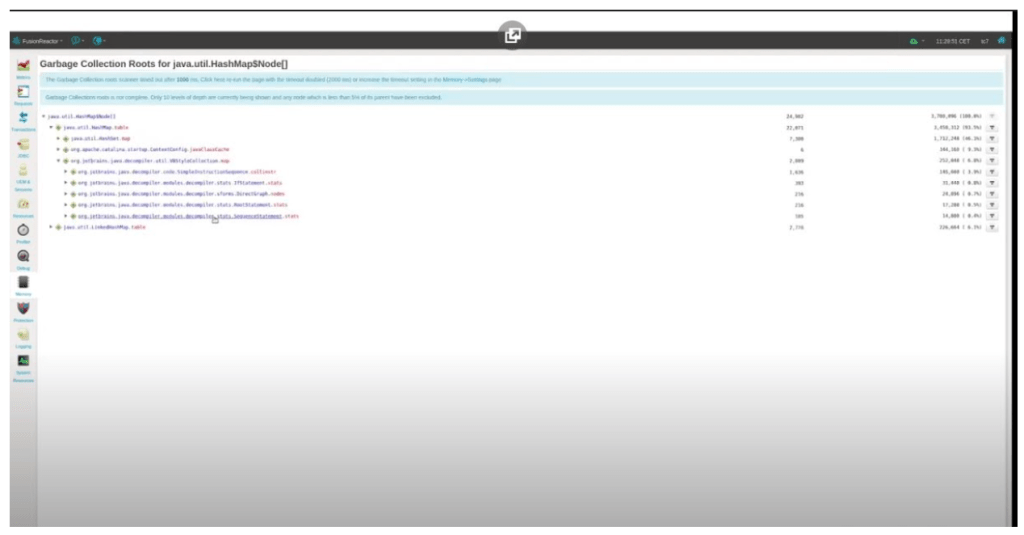
Analyze GC-Roots
Using the GC Root analysis feature, you can quickly identify memory leaks.
You get a memory leak when an object retains memory and cannot be collected because they are referenced from other live things.
N/B. Every leaked object is accessible from at least one GC root.
CPU Profiler In The FusionReactor
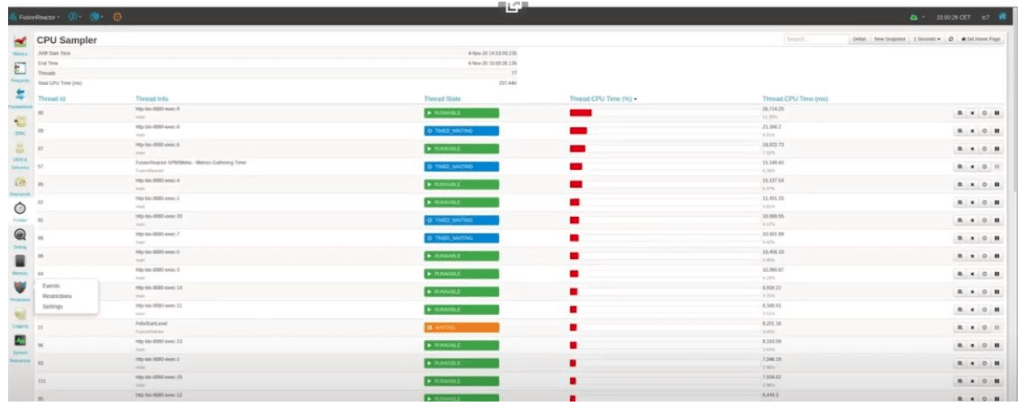
CPU profiler tracks the CPU usage per thread; this gives you an insight on background processes, pinpointing CPU-intensive requests or inefficient frameworks and applications running within the server.
From the primary view, you can see a list of threads accompanying its accumulative CPU usage since the application server was started. Threads can be stacked and traced to show what is running in real-time. It can also be paused and debugged for a thorough investigation of any suspicious behaviors occurring. The CPU usage can, over time, be compared between previous snapshots and present snapshots. From here, you can tell if there are heavily used threads that can be optimized to cut down on the java process’s resource usage of the java process.
FusionReactor Thread Profile
Easily find Deadlocks and thread contention issues: misusing threads can lead to several problems. It can lead to thread starvation. Threads can also block each other, impacting the performance of the application. By acquiring locks in the wrong order, you could generate a deadlock scenario.
So, understanding how threads work is important to understanding performance impact. Also, being able to profile threads is good for debugging purposes. FusionReactor, therefore, provides several views that offer lots of details on thread status. This allows you to instrument individual threads to get to the root cause of stability and performance-related issues. The thread-related issues can be found beneath the resources section on the left menu.
This includes thread activity which shows –
- Current running total thread
- Threads state, which breaks the threads down into their states.
- Also, thread visualizer- provides a real-time tubularization of the current view of all running threads.
- Threads can be sorted by elements such as CP, EPU
- You can also filter for specific threads such as NIO
Conclusion
Conclusively, you can say FusionReactor’s thread profiler is created to aid track CPU performance issues down to a specific thread or set of threads. It also allows you to see threads that are blocked or waiting too long. Other Profilers such as the continuous memory and GC profiling, Garbage collector, and low-memory profiler work uniquely to ensure you can quickly troubleshoot your application.
Continuous code profiling pinpoint performance bottlenecks super fast and super low overhead application performance profiler. Also, Performance Troubleshooting in Memory & Heap gives detailed insight into Java memory spaces and the garbage collector and real-time heap utilization to quickly spot possible memory leaks or excessive object creation. FusionReactor’s Thread Profiler provides Instant insight into how your application is performing, right down at the method level. FusionReactor is the best tool for java monitoring and fixing application performance issues you will find out there. Its resources help you effectively track, identify, and fix errors quickly, not negatively impacting your service’s overall performance.


