
How to identify deadlock conditions in Java
In this use case, we will examine how to identify deadlock conditions in Java environments. We will then take a look at FusionReactor and see how it picks up this issue. For the test environment, we are using Microservices, SpringBoot, and Eclipse in conjunction with FusionReactor.
- Cloud-Native Platform: RedHat OpenShift Online
- Java version: OpenJDK
- Application development platform: Spring Boot
- IDE: Eclipse
- Monitoring tool: FusionReactor Ultimate Cloud
Java, Spring Boot and Red Hat OpenShift troubleshooting with FusionReactor
Video by Pierre-Hugues Charbonneau
What is a deadlock?
Deadlock describes a situation where two or more threads are blocked forever, waiting for each other. Consequently, a deadlock occurs when multiple threads need the same locks but obtain them in a different order.
For this use case, we have programmatically created a deadlock.
Identify a deadlock using your JVM
A simple way to detect deadlocks is to use the automatic thread lock detector in the Jstack JVM.

Identify a deadlock using FusionReactor
FusionReactor on the other hand will give you more information.
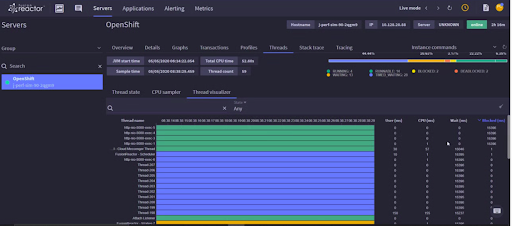
The FusionRector thread visualizer gives you a live breakdown of threads. Consequently, these threads can be broken down by users and CPU weight. Considering that a deadlock is a serious issue then the visualizer allows you to see exactly what is happening by showing you the block on the actual thread.
How to identify a deadlock using a profiler
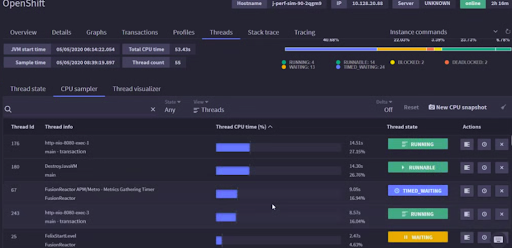
The FusionReactors sampler profiler shows us the state of our threads. The sampler will allow you to visualize and have a stack of the thread.
Stacktrace a deadlock
A transaction is also captured when deadlock occured, so from here you can view the transaction or take a look at the stack trace.
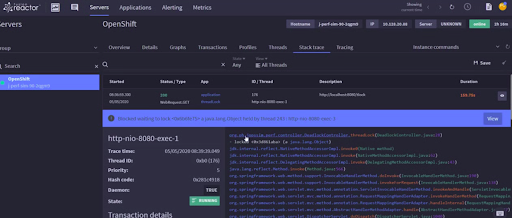
How to see where the deadlock is happening
We can see details of the transaction or dive into the profile. The profile tells us that the thread is mostly sleeping, but is stuck in a deadlock.
How to get the full context of the deadlock
FusionReactor will show you not only the deadlock but also the full context of the deadlock including the ability to visualize the thread and understand its state, and the history of the requests. This enables you to go back in time and troubleshoot further.