How to Find Memory Leaks in Your Application
In software development, finding memory leaks is one of the most essential stages of the whole development process. It is worth noting that the most modern Integrated Development Environment (IDE) comes fully packed with a suite of debugging and profiling tools. These profiling instruments aren’t a universal remedy since they only pinpoint the part of the application which is using the most memory. It doesn’t indicate directly what portions of your application are faulty. Nonetheless, developers are known to sidestep this crucial phase of application testing, mostly due to negligence, ignorance, or both. In this guide, we will discuss how to check:-
- if your application has a leak
- how to spot the exact location of the memory leaks
- measures to redress leakages in your applications running on a Windows OS.
What is a Memory Leak?
The term ‘memory leak’ simply refers to a process where software is unable to efficiently manage the available resources; the RAM thus resulting in overall performance degradation of the application and its host machine. A proper functioning system is one in which the RAM resources are dynamically allocated to ‘requesting’ software; hence the name application. Upon completing its tasks and when the software no longer needs these resources, these memory resources are returned and reallocated to the next software, application, or program in need.
How to Detect A Memory Leak in your application?
The best approach to checking for the existence of a memory leak in your application is by looking at your RAM usage and investigating the total amount of memory been used versus the total amount available. Evidently, it is advisable to obtain snapshots of your memory’s heap dump while in a production environment. In doing so, you get firsthand insight into the traffic specifications; since the traffic type, volume, and pattern all play a vital role in determining the object type and number of objects to be created in the memory. You can recreate this step in your test environment if you have a mechanism that mirrors exactly the production traffic pattern. Another source of memory leak in running applications is large file uploads by the user which if not properly managed could overwhelm the application’s memory. Hence, the approach, in this case, would be the use of automated tools.
How to Resolve Memory Leakages?
In cases where you experience memory leakages as described above, it means that software has trapped the RAM, and denies every other applications access to it. Over time a large portion of the RAM gets entangled by this defective procedure.
STEPS:
- Take Snapshots of Heap Dump: –
It is good practice to capture your heap dump every 10 – 15 minutes, prior to launching an application. That way, you can analyze heap dump snapshots that are based upon real traffic. Since heap dumps are pretty much snapshots of your memory, these memory depictions reveal profiling data on allocated objects that reside in memory. This includes; inbound & outbound references as well as values that are stored in those objects. These snapshots are compared and the differences utilized as a benchmark for analyzing memory usage. You can use this using the following command: –
In software development, finding memory leaks is one of the most essential stages of the whole development process. It is worth noting that the most modern Integrated Development Environment (IDE) comes fully packed with a suite of debugging and profiling tools. These profiling instruments aren’t a universal remedy since they only pinpoint the part of the application which is using the most memory. It doesn’t indicate directly what portions of your application are faulty. Nonetheless, developers are known to sidestep this crucial phase of application testing, mostly due to negligence, ignorance, or both. In this guide, we will discuss how to check:-
if your application has a leak,
how to spot the exact location of the memory leaks
measures to redress leakages in your applications running on a Windows OS.
where pid: is the Java Process Id, whose heap dump should be captured
file-path: is the file path where heap dump will be written in to.
2 – Capture Disturbed Heap Dump: –
Essentially, this step is initiated to take note of the heap dump the application displays an OutOfMemoryError and just moments before it crashes. Just as step one is undertaken for the purpose of fetching heap snapshots through actual traffic, this step will capture these memory heap dumps before it crashes. Consequently, it is best to initiate the application with the JVM property described below – considering we do not necessarily know when the application would crash.
file-path: is the file path where heap dump will be written in to.
3 – Comparing Heap Dumps: –
From the above step, we are able to determine the causative agent creating the memory leak. This is simply done by marking out those objects with size discrepancies as shown in step 1 and 2 above. With this, we could determine the objects causing the leaks.
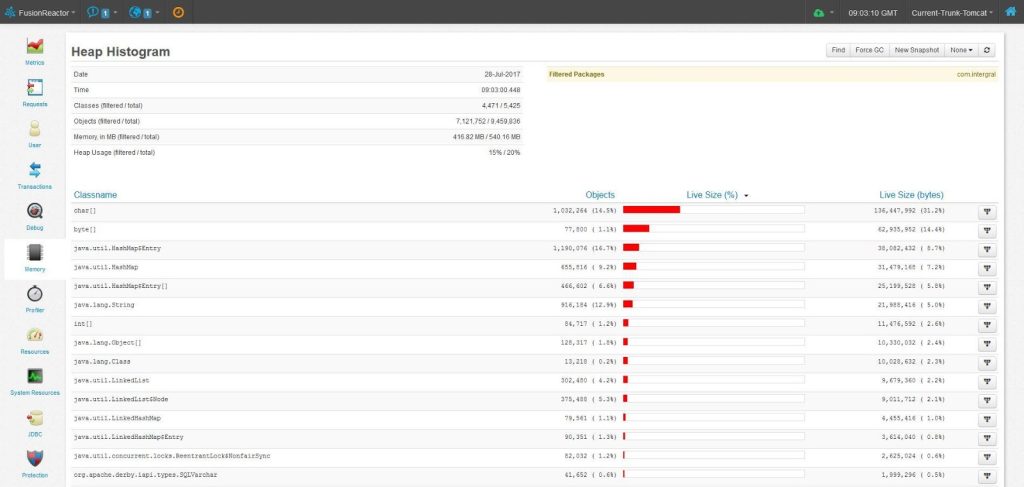
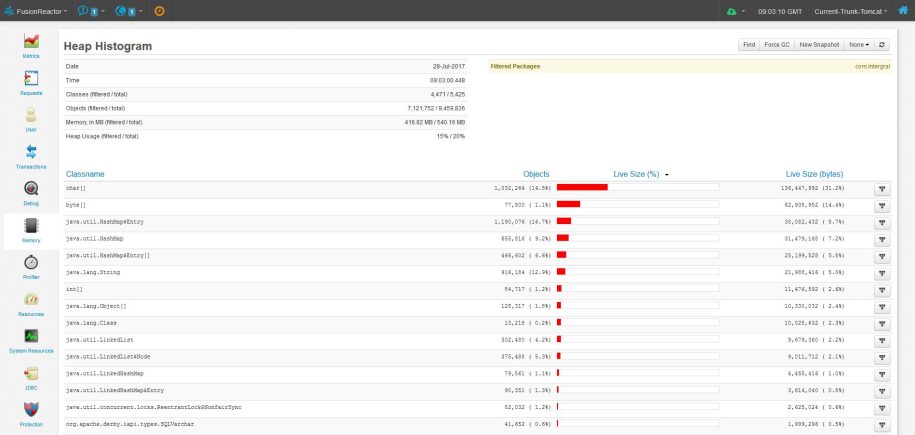
Figure 1: Displays the sizes (in bytes and %) of classes and objects in descending order.
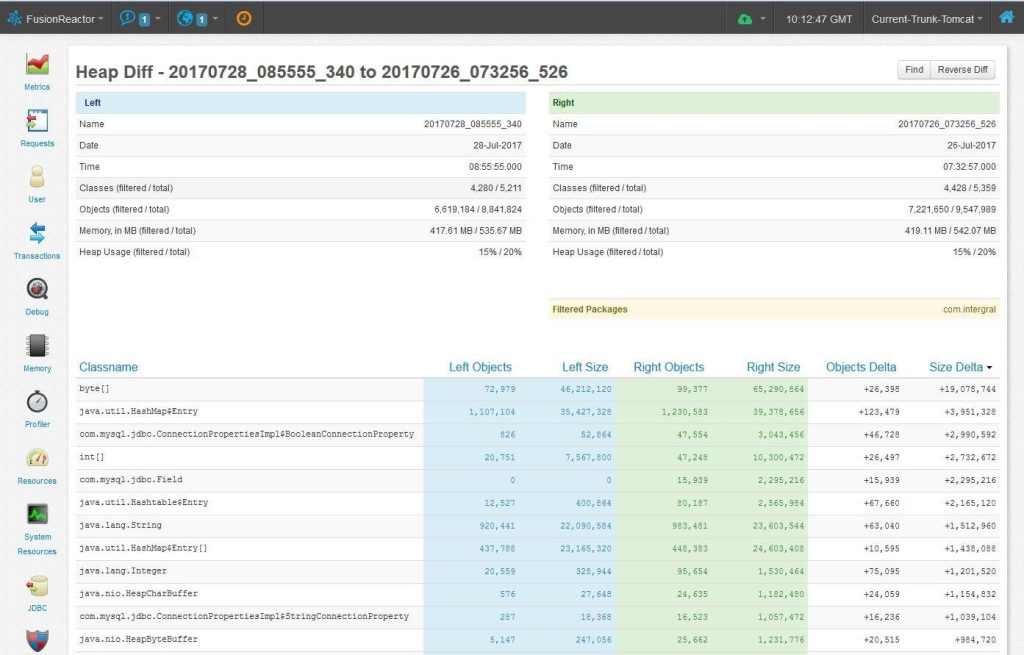
Figure 2: Compares the difference in heap dumps between two different time frames.
How to Find Memory Leaks in Your Application
In my experience, memory leaks are more predominant within the realm of older and low-level programming languages such as Java, C, and C++. Due to the advent of cloud computing technologies, memory spaces are now abundantly allocated for development. Subsequently, most modern programming languages do not require you to specify your own memory, or even release it once done. For this reason, a good number of developers do not even know what a memory leak is, not to mention how to handle it. Tools like FusionReactor have low-level capabilities that incorporate memory profiling and allow you to quickly find memory leaks as they occur.


