What is Distributed tracing, and what is distributed tracing used for?
The main benefit of Distributed Tracing is that it provides end-to-end visibility into the performance of applications.
A distributed tracing method tracks how application requests flow from front-end hardware to back-end databases and services in distributed cloud settings.
Distributed tracking trails interactions are used as a specific identifier. While interacting with infrastructures, containers, and microservices, the transaction retains the unique identifier used to mark the interaction. Thanks to this particular identity, real-time insight into the user experience is obtained from the top of the stack, the application layer, and the infrastructure underneath.
Distributed Tracing is a tool developer may use to analyze requests exhibiting significant latency or errors. Let’s examine distributed tracing’s dynamics and operations, their significance, and the tools needed to get started.
How Distributed Tracing Works
Microservices have recently been used to build a variety of apps. This is so developers can test apps more easily, deliver changes more quickly, and prevent problems thanks to microservices. Developers may see the whole flow of a request from the front end to the back end using end-to-end distributed tracing.
In a microservice architecture, an application is divided into modular services. Every service performs a core application function, typically managed by a specialized team.
Unfortunately, employing microservices may be difficult to debug since their backends are often complex. It is challenging to parse because of the convoluted backend and the possibility of various service call sequences in the requests.
For example, when a user fills out a form on a website, distributed tracing systems begin collecting data right once. Developers can completely understand the path taken by a request thanks to end-to-end distributed tracing. Any performance issues or bottlenecks that arise along the route may be quickly recognized.
This request starts the tracing platform’s construction of a distinguishing identification, a special trace ID, and an initial span (also known as the parent span).
A trace represents the complete request execution path, and each span in the trace represents a discrete piece of work performed along the way, such as a database query or an API call.
A top-level span called the child span is created when the request enters a service.
The child span can act as a parent span to child spans nested under it if the request makes multiple commands or queries within the same service.
Each child span is encoded with the original trace ID, a unique span ID, duration and error data, and relevant metadata, such as customer ID or location. This is all done by the distributed tracing platform.
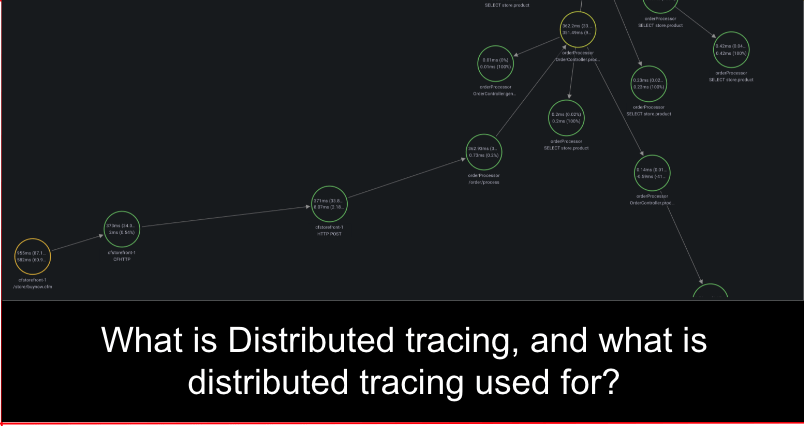
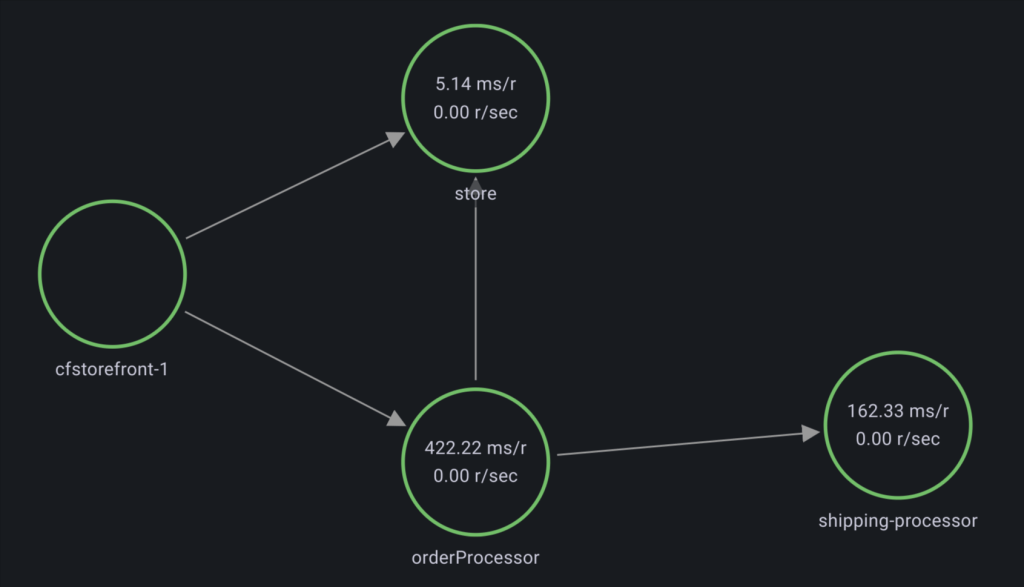
Ultimately, every span is visualized in a service graph, with the parent span at the top and child spans embedded below in order of occurrence.
It is easy for engineers to see the duration of time the request stayed in each database or service because each span is timed.
Distributed traces are viewed as service graphs that display each service call and the time each request spent in that service.
Developers can use the service graph to determine which calls exhibited errors.
What is Distributed Tracing compared with Logging
Distributed tracing and logging have notable variations, but they let engineers track and analyze performance issues.
In contrast to distributed traces, which only occur at the application layer and provide information about requests when they cross service borders, logs might come from the application, infrastructure, or network layers.
In your system, each time-stamped record corresponds to a particular event. For instance, if a container runs out of memory, it may produce a log. You may use distributed trace to see the full request flow and identify the precise location of any errors or bottlenecks.
You should review the request’s logs for improved outcomes and go further into the source of an error or slowness. See how to monitor your logs using distributed tracing.
Benefits and Challenges of Distributed Tracing
Many businesses use microservice architecture, and as this number climbs, so does the need for distributed tracing and better observability. Some advantages of employing distributed tracing for frontend engineers, backend engineers, and site reliability engineers are listed below:
What is Distributed tracing used for? find and fix errors faster
When a report is made about a slow or broken application, developers can review the distributed traces to help the support team determine if the issue is from the backend. Since Distributed traces are generated for every service, Engineers can easily assess the traces generated by the specific affected service and immediately troubleshoot the issue.
An end-to-end distributed tracing tool allows you also to investigate frontend performance issues using the same platform.
Understand service relationships
Developers may improve their performance by understanding the cause-and-effect links across services thanks to the exposure and insight acquired by viewing distributed traces.
For instance, one may realize that adding a new database record causes a delay in an upstream service by looking at a span produced by a database request.
Measure specific user actions
With distributed tracing, you can accurately measure the time it takes to complete key user actions, like purchasing an item.
Distributed traces help you identify backend errors or bottlenecks that negatively affect the user experience.
Improve collaboration and productivity
Accountability and productivity are enhanced because distributed tracing clarifies at what point an error occurred and what team is responsible for it.
Whereas, in microservice architectures, the services involved in completing a request may be owned by different teams.
Maintain Service Level Agreements (SLAs)
Service Level Agreements are contracted organizations with customers or other internal teams to meet their performance goals. Distributed tracing tools aggregate performance data from the same services; this allows teams to evaluate if they comply with Service Level Agreements readily.
What is Distributed tracing – the challenges
Distributed Tracing has great benefits and advantages, no doubt; however, there are some challenges associated with its implementation:
Time Consuming
Because specific distributed tracing platforms expect you to manually instrument or modify your code to start tracing requests, distributed tracing takes time. Valuable engineering time is consumed when Manual instrumentation is done. It can also introduce bugs in your application.
This does not apply to every distributed tracing platform. It depends on the language or framework that you want to instrument. You can also get missing traces from standardizing what parts of your code to instrument.
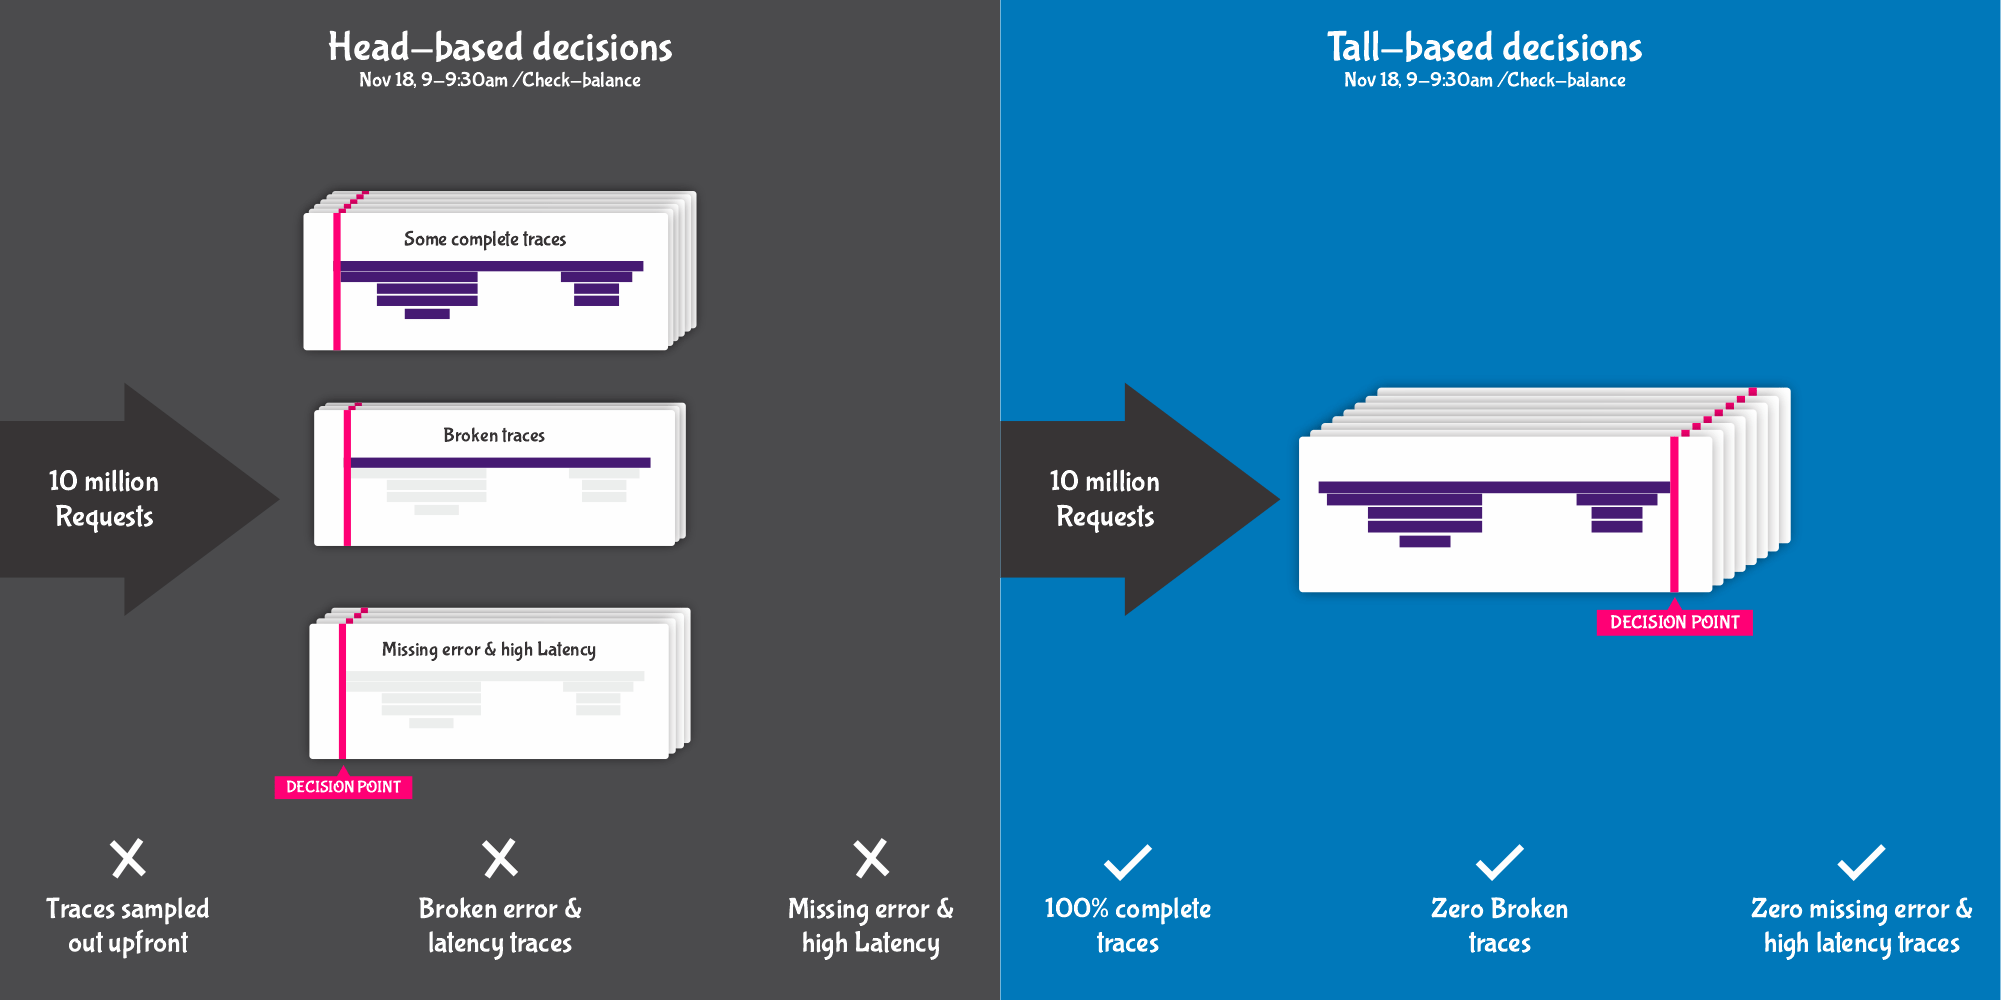
Head-based sampling
As each request begins, traces are randomly sampled, which often leads to incomplete and missing traces.
Relevant traces are often missed, such as requests from enterprise customers or high-value transactions.
Some modern platforms have fixed this by their ability to ingest all traces and rely on tail-based decisions, allowing you to capture complete traces tagged with business-relevant attributes, like the customer ID or region.
Lack of access to frontend
When a request is made, a trace ID is created only when it gets to the first backend service. This happens unless you use an end-to-end distributed tracing platform.
The fact that you do not get to access the corresponding user session on the frontend, makes it harder to find out what the root cause of a problematic request is and if it is to be fixed by a frontend or backend team.
Distributed Tracing Tools
With distributed tracing tools (those that use tail-based judgments), you can be guaranteed that developers will cover all of your traces completely.
In a high-throughput system, developers may produce millions of spans every minute, making it challenging to track and pinpoint the most important traces of your applications. Several technologies may assist you in surfacing the most useful performance data.
Modern distributed tracing technologies handle the following three request tracing phases:
Instrumentation
First, you must modify your code so requests can be recorded as they pass through your stack. You also are not required to change your code manually. Instrumentation is supported in multiple languages and frameworks.
Data collection
After submitting your code, a distributed tracing tool will collect span data for each request.
Analysis and visualization
Lastly, the spans are merged into a single distributed trace and encoded with unique business-relevant tags for analysis. The traces may be visualized as service graphs or other graphs, depending on the distributed tracing tool you’re using.
Moving Forward – What is Distributed tracing, and what is distributed tracing used for?
FusionReactor offers comprehensive distributed tracing for businesses of any size and Application Performance Monitoring (APM). You may gather performance statistics or combine FusionReactor with open-source instrumentation and tracing tools using the auto-instrumentation libraries provided by FusionReactor. With Tracing without Limits, you may search and analyze your traces simultaneously without any sample.
You can keep your business-critical traces using UI-based retention filters while controlling costs. With tail-based decisions, you are guaranteed continuous visibility into traces that show errors or high latency.
FusionReactor’s unified platform allows you to easily correlate traces with logs, infrastructure metrics, code profiles, and other telemetry data to resolve issues without any context switching quickly.


