
Performance monitoring is a critical aspect of any software application development and deployment. It ensures that applications are running efficiently and effectively, and helps identify any issues that could negatively impact the user experience. With the rise of microservices architecture and the increasing complexity of modern applications, performance monitoring has become more critical than ever.
Spring Boot, a popular framework for building Java-based applications, has become the go-to choice for many developers. The framework provides a range of features and tools to help developers build and deploy applications quickly and easily. However, with the increasing complexity of modern applications, monitoring and maintaining performance levels can be challenging.
This blog post will explore the importance of performance monitoring in Spring Boot and provide a comprehensive guide to monitoring your applications. We’ll also introduce you to FusionReactor APM, a powerful performance monitoring solution designed explicitly for Java-based applications.
Why is Performance Monitoring Important in Spring Boot?
Performance monitoring helps ensure your application runs optimally, providing the best user experience. It also helps identify issues that could negatively impact the performance of your application, such as slow page load times, high resource usage, and frequent crashes.
Additionally, performance monitoring helps identify bottlenecks in your application, providing insights into areas that need improvement. By monitoring the performance of your application, you can quickly identify and resolve any issues, ensuring that your application continues to perform optimally.
Spring Boot Performance Monitoring.
Modern applications are highly distributed in nature, and thus they are often bundled with various dependencies like Database, caching and much more. Monitoring becomes essential due to the complexity of the implementation scheme that comes amid such advanced software. The Spring Boot Performance Monitor is a library kit that comes preinstalled with any Java Agent. It utilizes HTTP endpoints or JMX beans – because you can also configure the proxy profile to display Spring Boot JMX metrics, to enable us to interact with it. By way of this, we get firsthand reading of operational information about the running application – health, metrics, info, dump, env, etc.
The Spring Boot Monitoring toolset provides you with an immediate and extensive insight into your Java applications running on the Spring MVC Framework. In its essence, the Spring Boot Performance Actuator is a unifier that introduces production-ready features into our application. With this dependency manager, such functionalities as gathering metrics, monitoring our apps, understanding traffic in addition to the state of our Database becomes inconsequential. The Spring Actuator discovers the application name through of the spring.application.name, property located in the application.properties file or the SpringBoot Application startup class, if the spring.application.name property is not defined.
The Spring Boot Actuator
Notably, Spring Boot supports many additional features that help you manage and monitor your application, from the development stage, extending to production. Such auditing exercise as metrics and health gathering are seamlessly implemented through the Spring Boot Performance Monitor. Once installed onto the classpath, this dependency supplies us with several endpoints right out of the box.
As with several other Spring modules, we can extend and configure the Spring Boot Actuator in a variety of ways, of which we would be looking into shortly.
Getting Started
Typically, a monitoring system would have three core components which include;
- Dashboard for the visualization of data stored in the Database.
- A Metric Store – Time-series Database. For example, Prometheus, InfluxDB, TimescaleDB etc.
- Applications that periodically supplies the Metric store with metrics data from the application’s local state.
We can go on ahead to have other components installed as well like alerting – where the alert channel could be via Email, Slack or other conventional media. Alerting components would be sending alerts to the application owners or subscribers of events. For this guide, we would be using Grafana as a dashboard and alerting system, Prometheus as a metrics store system.
The Requirements
- An IDE
- Java Development Environment
- Gradle
Now we create a project from the Spring Boot initializer, after which we add dependencies – as much as we want to. Next, we use the Micrometer library, which is an instrumentation façade that provides bindings for many metric stores like Prometheus, New Relic, Datadog, to mention a few.
Micrometre provides the following functionalities ready for use;
1. JVM.
2. Database.
3. HTTP request.
3. Cache system and related metrics.
While some of these metrics are enabled by default, others are subject to customized settings. For this feature; we would employ the application.properties file to handle enabling, disabling and customization. We would also need to use the Spring Boot Actuator to expose the endpoint of the Metric Store – Prometheus.
Steps: –
- Add these following dependencies in build gradle file just as done in line 7 of figure 1.:
- io.micrometer:micrometer-registry-Prometheus.
- org.springframework.boot:spring-boot-starter-actuator.
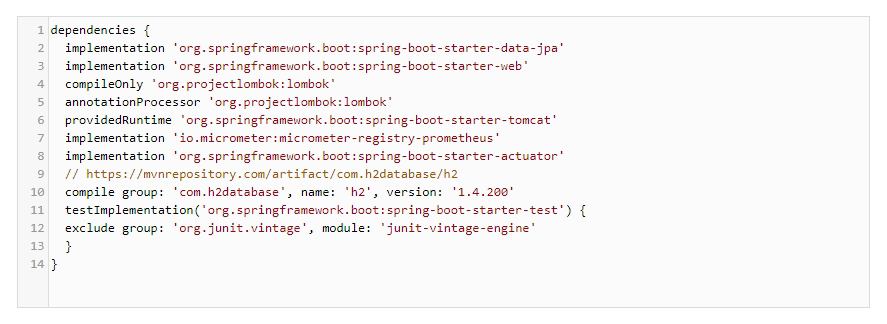
Figure 1:
- We would enable the Prometheus export functionality by adding the following line to the properties file.
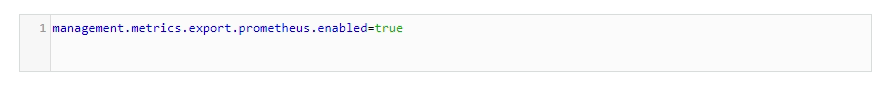
Figure 2:
- As soon as the above command is enabled Micrometer automatically accumulates data about the application. This data can be viewed by visiting the actuator / Prometheus endpoint – which is used in the Prometheus script to fetch data from our application servers.
Although we have included the line mentioned above of code into the properties file, we still won’t be able to browse the Prometheus endpoint since it is disabled by default. For that, we head on to the management endpoint and add Prometheus in the list.
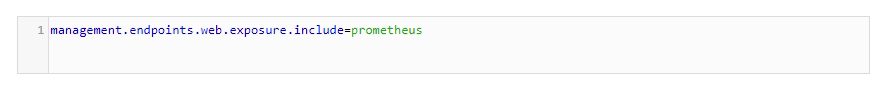
Figure 3:
Note:
Not all endpoints are enabled from actuator as this could lead to a security loophole. Hence, we choose endpoints selectively, especially in a production environment. Even though we need to use these endpoints, it is not advisable to expose certain endpoints to the whole world as we place a whole lot of sensitive application data at risk. Therefore, it is best to use some proxy to hide these endpoints from the real world.
Also, various components of the HTTP requests are customizable much like the SLA (Service Level Agreement), percentile histogram should be computed or not. This can be done through the metrics—distribution properties.
A sample application.properties can contain the following lines;
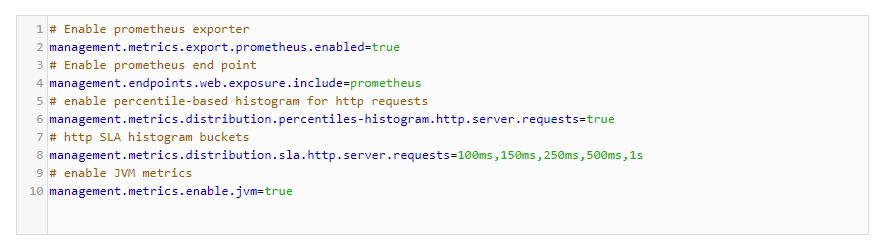
Figure 4:
- We can now run the application and navigate to the page http://locahost:8080/actuator/prometheus on a browser, to view our data.
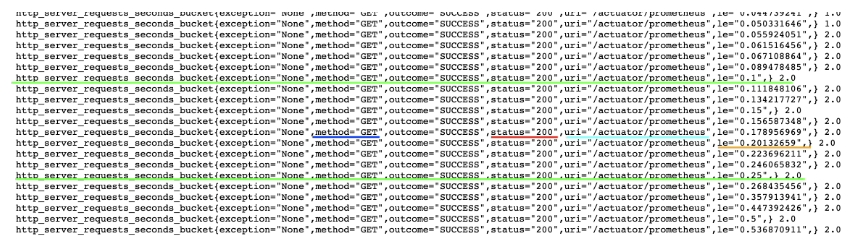
Figure 5:
-
- The above data displays HTTP request detail, such as
- exception=None, which means there is no exception just as the name implies. If any, we can use that to filter how many requests have failed due to that exception handler.
- method=GET HTTP method name.
- status=200 HTTP status code is 200.
- uri=/actuator/prometheus displays the URL path.
- le=xyz displays the processing time.
- N.0 displays the number of times that endpoint was called.
This data can be represented as a pie-chart or histogram that can be plotted in Grafana, for example, to plot p95 over 5 minutes we can use the following query.

Figure 6:
Custom Metrics
Most times, we might need to customize our metrics where some of such use-cases include the number of logged-in users, number of orders in the order queue, currently available stock details etc. Certain business use cases can be solved using custom metrics. Thus, Micrometer supports multiple kinds of metrics like Gauge, Counter, Timer, Long task timers, Distribution summaries etc. But for the scope of this walkthrough, we would focus mainly on Gauge and Counter. Gauge gives us instantaneous data like the length of a queue, whereas the counter is much like a uniformly increasing number, starting from one.
For this, we’re going to create a demo stock manager that will store details in memory and would provide two functionalities:
1. Add items.
2. Get items.
By that, we’ve created a single counter and an available gauge in the init method. Therefore, whenever getItems is called, we increase the counter as well as to measure the stock size. While a call to addItems updates the gauge.
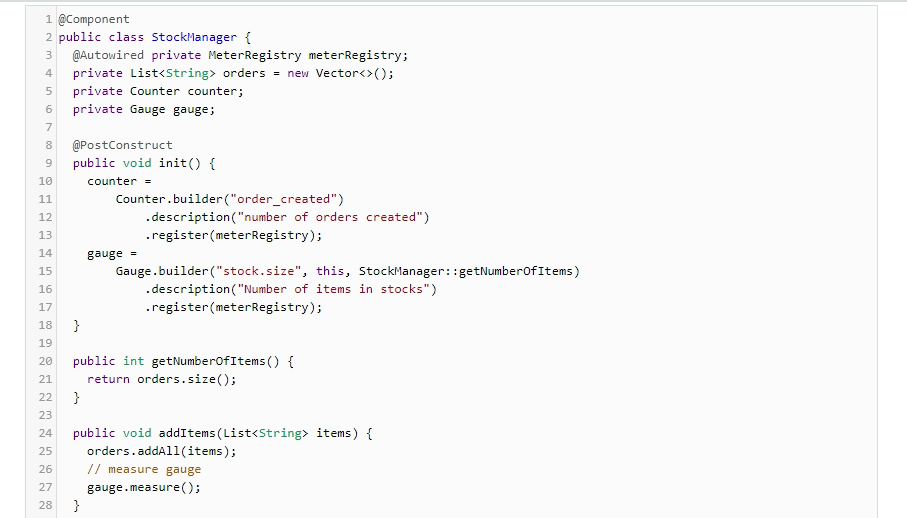
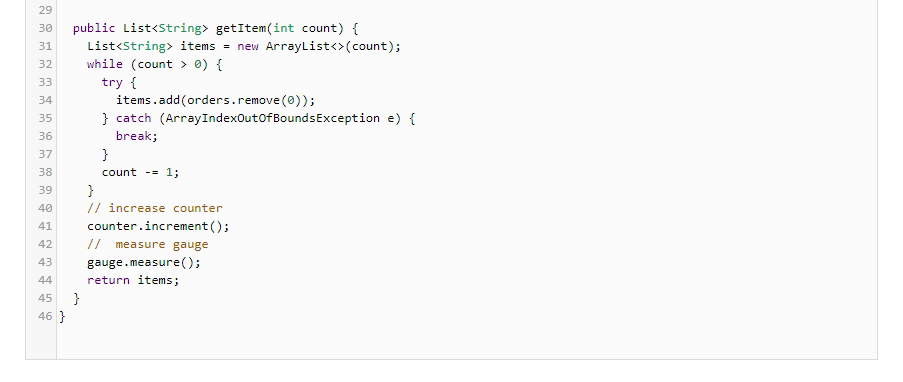
Figure 7:
For demonstration purposes, we’ll add two endpoints to add items and get items.
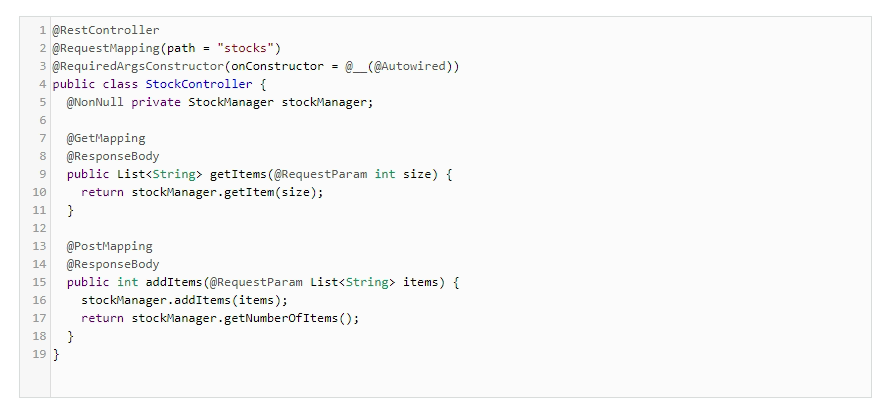
Figure 8:
Firstly, we add ten items using two API calls.
- Curl -X POST http://localhost:8080/stocks?items=1,2,3,4
- Curl -X POST http://localhost:8080/stocks?items=5,6,7,8,9,10
Now if we browse to Prometheus endpoints, then we can see the following data indicating that we currently have 10 items in the stock.
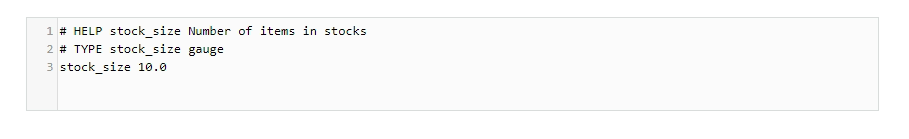
Figure 9:
Now, we’re going to place an order of size three;
Then again, if we browse Prometheus endpoint, then we get the following data that indicates stock size has been changed to seven.
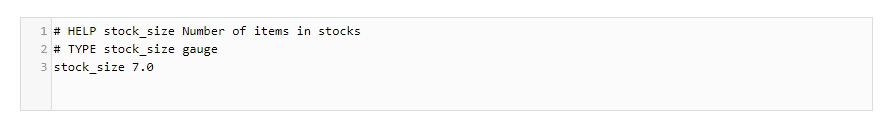
Figure 10:
We could also see that the counter has been updated with a value of 1. This indicates that just a single order has been placed.
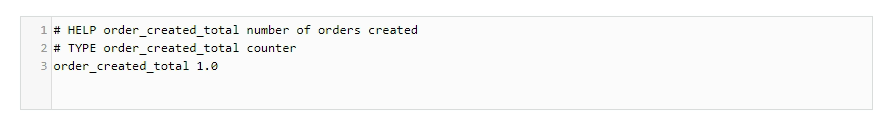
Figure 11:
Using FusionReactor APM for Performance Monitoring
FusionReactor APM is a powerful performance monitoring solution designed explicitly for Java-based applications. It provides a comprehensive set of tools to help you monitor and optimize the performance of your Spring Boot application. Some of the key features of FusionReactor APM include:
- Real-Time Monitoring: FusionReactor APM provides real-time application monitoring, providing detailed information on your application’s performance.
- Detailed Performance Analytics: FusionReactor APM provides detailed performance analytics, including information on memory usage, CPU usage, and more. This information can be used to identify performance bottlenecks and optimize the performance of your application.
- Code Profiler – Production Safe / instantly see performance bottlenecks.
- Memory Profiler – Production Safe / Real-time heap analysis to locate memory leaks.
- Instant Code decompilation.
- JMX MBeans Support.
- Advanced Debugging Tools: FusionReactor APM includes advanced debugging tools, including a powerful debugger, profiler, and code tracer. These tools can be used to identify and resolve performance issues quickly and effectively.
- Scalable and Flexible: FusionReactor APM is scalable and flexible, making monitoring large and complex applications accessible. It can be configured to monitor specific application parts, providing you with the information you need to optimize performance.
Conclusion – Spring Boot Performance Monitoring
Performance monitoring is a critical aspect of any software application development and deployment. With the rise of microservices architecture and the increasing complexity of modern applications, monitoring performance is more critical than ever. In this blog post, we have discussed the importance of performance monitoring in Spring Boot and provided a comprehensive guide to monitoring your applications. Additionally, we introduced you to FusionReactor APM, a powerful performance monitoring solution designed explicitly for Java-based applications.
With FusionReactor APM, you can monitor your application in real time, providing detailed performance analytics, advanced debugging tools, and a flexible and scalable solution. Whether you’re a small startup or a large enterprise, FusionReactor APM provides the tools you need to monitor and optimize the performance of your Spring Boot application.
In conclusion, performance monitoring is essential for ensuring the optimal performance of your Spring Boot application. With the right tools and techniques, you can quickly and easily monitor the performance of your application and ensure that your users are getting the best possible experience.