
Java exceptions are an integral part of the Java programming language and are used to signal that an error has occurred during the execution of a program. While some exceptions are well-known and commonly encountered, such as NullPointerException and OutOfMemoryError, many other exceptions are less commonly encountered. However, they can still have a significant impact on the performance and functionality of an application. This article will discuss 10 Java exceptions you may not have encountered and different ways to detect and diagnose them, including using an APM (Application Performance Management) tool, logging, debugging, code review, monitoring, and profiling.
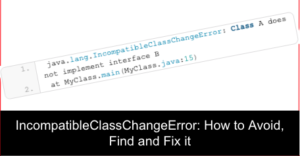
The IncompatibleClassChangeError is thrown when an incompatible class change has occurred to some class definition. This can occur when a class file is loaded by the JVM and the class file is not the same as the previously loaded class.
When an application tries to access a non-existent field in a class, the NoSuchFieldError is thrown. This can occur when a class file is loaded by the JVM and the class file does not contain the field the application is trying to access.
The IllegalMonitorStateException is thrown when a thread tries to perform an illegal operation on an object’s monitor. This can occur when a thread attempts to wait on an object it does not own or when it attempts to notify a thread not waiting on the object.
When an application tries to call a non-existent method in a class, the NoSuchMethodError is thrown. This can occur when the JVM loads a class file, and the class file does not contain the method the application tries to call.
IllegalAccessError is thrown when an application tries to access a class member it does not have access to. This can occur when a class file is loaded by the JVM and the class file is package-private or private.
ClassCastException is thrown when an application tries to cast an object to a class that it is not an instance of. This can occur when the JVM loads a class file, and the class file is not a subclass of the class to which the application is trying to cast the object.
The InterruptedException is thrown when a thread is interrupted while it is waiting or sleeping. This can occur when a thread is interrupted by another thread or by the JVM.
SecurityException is thrown when an application tries to perform a security-sensitive operation it is not authorized to perform. This can occur when the JVM loads a class file and contains code that attempts to perform a security-sensitive operation.
There are several other ways you can find and diagnose less common Java exceptions in your application in addition to using an APM tool like FusionReactor:
- Logging: Enabling your application can help you capture and diagnose exceptions as they occur. Using a logging framework such as Log4j or SLF4J, you can configure your application to log exceptions at different levels (e.g., error, warning, info) and to output the stack trace of the exception to a log file.
- Debugging: You can use a debugger such as Eclipse or IntelliJ to step through the execution of your application and inspect the state of the application when an exception occurs. This can help you identify the specific code line that caused the exception and understand how the exception propagated through the application.
- Code review: Reviewing the application’s code can also help you identify and fix the root cause of an exception. This can be done by looking at the code that throws the exception, the methods that are called before the exception is thrown, and the variables used in the methods.
- Monitoring: Monitoring the application’s resource usage, such as CPU, memory, and disk I/O, can help you identify an exception’s root cause.
- Profiling: Profiling the application using a tool such as JProfiler or YourKit can help you identify performance bottlenecks and understand how the application uses its resources. This can help you identify the specific code line that caused the exception and understand how the exception propagated through the application.
It’s important to note that no single method can detect all types of exceptions, so it’s best to have a combination of techniques in place to have the most comprehensive coverage.
To find these exceptions, you can use an APM tool, such as FusionReactor. These tools allow you to monitor your application in real-time, identify performance bottlenecks, and track the occurrence of exceptions. They also provide detailed information about the exceptions, including the stack trace, the thread that threw the exception, and the line of code that caused the exception. By using an APM tool, you can quickly identify and fix the root cause of these exceptions, improving your application’s performance and stability.
One of the key features of an APM tool is its ability to trace the execution of a request as it flows through your application. This allows you to see the exact method calls and the sequence in which they were made. This can help you identify the specific code line that caused the exception and understand how the exception propagated through the application.
Another essential feature of an APM tool is its ability to aggregate and analyze performance metrics. These metrics can help you understand your application’s overall performance, including the number of requests per second, response time, and error rate. This can help you to identify trends and patterns that may indicate a performance issue, such as a sudden increase in the number of exceptions.
In addition to these features, an APM tool may include other capabilities, such as alerting and reporting. This can be useful in helping you to detect and diagnose problems quickly and to share information with other members of your team.
Conclusion – Diagnosing Less Common Java Exceptions: Techniques and Tools
In conclusion, less common Java exceptions can significantly impact the performance and functionality of an application. To detect and diagnose these exceptions, it’s important to use a combination of techniques, such as using an APM tool, logging, debugging, code review, monitoring, and profiling. By having a comprehensive approach to detecting and diagnosing exceptions, you can quickly identify and fix the root cause of these exceptions, improving your application’s performance and stability.