

Why monitor a monolithic server?
It is quite challenging to improve the performance of a monolithic server application. Change is difficult when things are tightly coupled. Unlike microservices, where things are more likely to be managed by development teams. However, optimizing the performance of a monolithic application is not impossible, particularly if you have the right toolset.
There are many tools that will help, many mainstream APM’s have left monolithic servers behind and are focussing on microservices and distributed systems. FusionReactor has an on-premise APM that was built specifically to improve performance on monolithic servers. It also has a Cloud observability platform that looks after distributed systems. Both the on-premise and the Cloud versions continue to be developed by the Intergral GmbH software house in Germany.
Possible solutions to monolithic application issues
- People move from one team to another or from one organization to another as time goes on. Due to the centralized nature of monolithic code-bases, with time a specific portion of code might become idle. Consequently, the piece of code may no longer belong to anyone.
- With a team working on different components of the code, there is no clear separation of services, and there is no contract or SLA.
- The lack of separation of services makes it difficult to find the regression. Consequently, it can be difficult to discover the root cause when a component starts to degrade.
Improve the performance of your monolith
- An API often accumulates a lot of data as it keeps on being used. As a result, these become obsolete with time, so they should be disposed of if not needed.
- Putting similar tasks together in parallel can be useful if their nature and performance are comparable
- Using a request-level cache is important in a monolithic architecture because there are many calls within a request, which means it has a greater chance of getting invoked. Use the Request Scope Cache for evaluation. Therefore, the first invocation is cached during execution.
A good APM will enable you to improve the performance of a monolith system both quickly and with relative ease. Changing anything within a monolith is difficult as things are so tightly coupled together.
Maintaining monolithic servers is often difficult due to code decay and technical debt
50% of developers use both monolith and distributed environments, according to a recent survey. The reason for this is that many older applications are vital for infrastructure but suffer from technical debt and code decay. They function okay, so rewriting them would not be the best option, since developing new applications often provides a higher return on investment. Monitoring monoliths is equally important to monitoring distributed systems. Arguably more so as apps on monoliths are often written in older code, that modern developers simply no longer learn. Applications like FusionReactor APM enable older applications to run efficiently with no need to recode or migrate.
Monitoring a Java Virtual Machine (JVM)
Java’s application architecture is built around the JVM (Java Virtual Machine). In essence, it interprets and converts Java byte code to host platform operations. In the event that the Java Virtual Machine (JVM), which is used by all Java middleware, such as Tomcat, JBoss EAP, WildFly, GlassFish, and WebSphere, experiences performance issues, the impact on services they support can be significant.
JVM monitoring is an essential part of any Java APM strategy. To resolve server-side bottlenecks, IT Ops and DevOps teams use JVM performance metrics, and JVM monitoring can also help developers and architects by discovering code-level problems.
Using an APM such as FusionReactor, you can identify code-level bottlenecks such as thread synchronization issues, deadlocks, memory leaks, garbage collection issues, and insufficient heap memory.
How can an APM help manage a monolithic server?
Automatic Root Cause Analysis
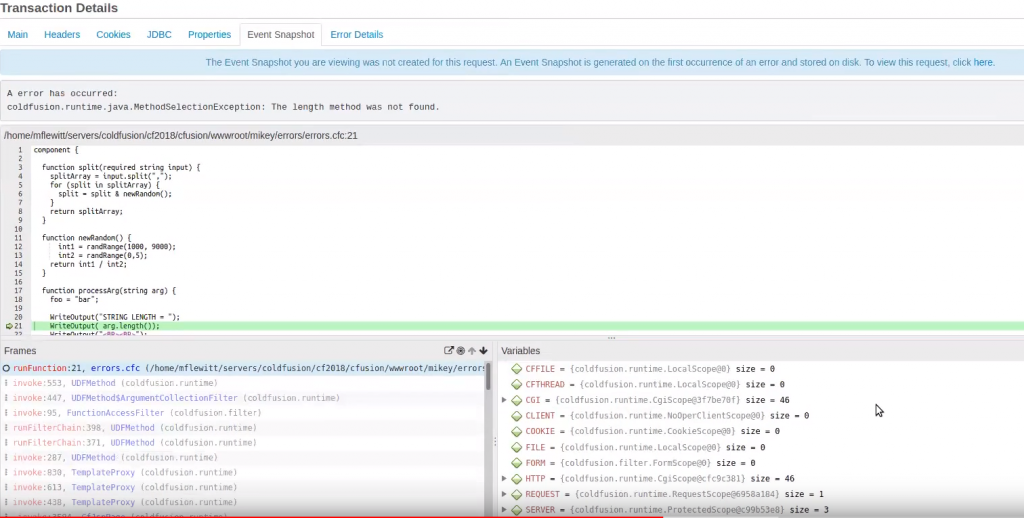
When a critical error or exception occurs within your monolithic server, an automatic Root Cause Analysis (RCA) capability can alert the developer immediately. In FusionReactors’ Event Snapshot, developers can view the complete source code, stack trace, variables, and environment state of errors at the point of occurrence. As a result, you will save several hours debugging and dramatically reduce Mean Time to Detect (MTTD).
Debugging in a production environment
QA phases, staging environments, and automation have all been used to prevent bugs from reaching production. Sometimes, however, bugs still reach production. Whenever they do, we need a strategy to deal with them in a safe and efficient manner.
Today’s debugging tools allow you to safely and reliably debug in a production environment without affecting users or causing downtime.
What makes it safe to debug monoliths in production?
There are a few things to keep in mind when debugging in production;
- Performance is not significantly affected by debugging
- You can still use your app and debug at the same time
- Secure data is not accessible from the outside
- Bugging provides you with enough information to locate and resolve the issue as soon as possible.
When you are debugging, you want as much information as possible in the shortest amount of time. It only adds to the stress of dealing with a critical issue to jump between multiple systems and retry to fix the bugs several times.
Use continuous profiling to find performance issues
Continuous profiling is the process of collecting data on application performance over time. Consequently, application developers analyze this data in production environments.
Continuous profiling is used to determine which components, methods, or lines of code are the most resource-intensive. This insight can be used to improve the performance of the profiled application and to understand runtime behavior.
FusionRector Ultimate has a number of continuous profiling tools including
Continuous code profiler
The Code Profiler makes it easy to run code performance analysis in your production environment at low overhead. Since profiles are generated automatically, you won’t miss any issues.
FusionReactor’s Code Profiler provides instant insight into how your application is performing down to the method level.
Continuous Thread profiler
Using continuous thread profiling and stack trace analysis, you can track down performance issues on your monolith quickly and efficiently. With an APM that includes a thread profiler, like FusionReactor, you can quickly profile or stack an individual thread to identify performance, deadlock, and concurrency issues.
Continuous memory profiler
You can gain a detailed understanding of Java memory spaces and garbage collection with continuous memory profilers. Consequently, you can identify memory leaks and optimize memory usage in your production Java applications by using the FusionReactor low overhead memory profiler and getting instant insight into the heap.
What is a memory leak?
An application defect causes a memory leak. Consequently, when an object retains memory and cannot be collected due to its reference to another live object, it is considered a memory leak. Therefore, leaked objects are accessible from at least one GC Root or are themselves GC Roots. Therefore, leaked objects have a path that starts with GC Roots and ends with the leaked object. Read our article on how to find memory leaks in your application for further details.
By utilizing heap utilization, the memory profiler detects possible memory leaks or excessive object creation in real-time.
Continuous CPU profiler
With a CPU profiler in your APM, you can find and tune inefficient processes running on your monolithic application server.
Java Profiler is a low-overhead tool that displays the code that’s being executed. As a result, you can determine what functions are running that might slow a thread down.
Conclusion – so how do you improve the performance of a monolithic server?
Monolithic performance can be challenging and hard to manage. However, to better manage it, you need to get deep insight into the metrics. Sometimes the simplest things are the most time-consuming. Consider using tools such as profilers and root automated cause analysis, not only to gauge their performance but also to quickly identify the reason if something goes wrong.